
This page provides regular updates, local insights, and expert commentary to help buyers and sellers make informed decisions.
Whether you’re considering selling your home or looking to buy in the area, understanding the market is key.
Midhurst Property Market Overview
The property market in Midhurst and the surrounding villages continues to show strong demand, particularly for character homes, country properties, and homes within the South Downs National Park.
Buyer demand remains driven by:
Lifestyle-led moves from London and the South East
Demand for countryside living and outdoor space
Limited supply of high-quality homes
New Estate Agency Legislation (about time!!!) – 19th June 26
Being one of the few agents in the area with any form of estate agency qualifications, I have been in favour of this for a very long time. As agents we are dealing with peoples often most expensive asset – their home! Do you really want someone who has little experience and no qualifications to represent you????
Below taken from Property Industry Eye
Estate agents look set to face significant new obligations under government proposals designed to speed up property transactions and reduce the number of sales that collapse before completion.
The reforms would require agents and sellers to provide key information about a property at the point of listing through mandatory sales packs. These packs would include details such as the property’s condition, leasehold charges and chain status, with the aim of giving buyers greater certainty earlier in the transaction process and allowing conveyancing work to begin sooner.
Alongside the disclosure requirements, the government has proposed a new Code of Practice for estate agents and is considering the introduction of mandatory professional qualifications across the sector. The measures are intended to raise standards, improve consumer confidence and support more efficient transactions.
The proposals also include the introduction of earlier binding agreements between buyers and sellers in an effort to reduce the number of transactions that fall through after months of negotiation.
The government estimates that the changes could reduce average transaction times by around four weeks. Currently, a typical home purchase takes around 120 days to complete, while approximately one in three agreed sales fails to reach completion.
For estate agents, the reforms would represent one of the most significant changes to the homebuying process in recent years, potentially requiring new processes for gathering property information, managing compliance and preparing vendors before a property is brought to market.
Prime minister Sir Keir Starmer said: “Getting the keys to a home you can call your own is one of the biggest events in anyone’s life. But right now, the system that should provide support instead turns it into a battle, leaving people in limbo and putting that opportunity out of reach.
“We’re turning the page. Our reforms will bring this outdated process into the modern age, saving people time and money, and giving them the certainty they deserve.
“This is about building a stronger, fairer Britain, one that works for the next generation and makes the dream of home ownership a reality for many more hard-working people.”

Housing secretary, Steve Reed, commented: “Buying or selling a home should be one of life’s great moments and not a drawn-out nightmare of delays, hidden costs, and failed deals.
“These changes will make the system faster, fairer, and more secure – giving families and first-time buyers the certainty they need all while saving them time and money.”
The chancellor Rachel Reeves added: “Delays, hidden costs, and deals collapsing at the last minute are not only bad for homebuyers, it’s bad for the economy too.
“Our reforms will cut those delays, cut costs and make the process quicker and more reliable – getting more people on the housing ladder while keeping more money in their pockets.
“We have the right economic plan – getting the housing market moving, building thousands more good-quality homes in every region, and transforming rights for renters.”
The government has outlined a phased timetable for the reforms:
Later this year, ministers plan to introduce a new Code of Practice setting minimum standards for estate agents, alongside guidance aimed at improving the quality and consistency of information included in property listings.
From 2027, the government intends to consult on mandatory qualifications for estate agents and expand the use of digital tools designed to support the homebuying process.
By the end of the current Parliament in 2029, legislation is expected to be introduced requiring the use of sales packs, earlier binding agreements between buyers and sellers, and digital systems that enable the secure sharing of property information throughout the transaction process.
18th May 2026
Is Now a Good Time to Buy in Midhurst?
The question I am being asked more than ever at the moment is simple: “Christian, is now actually a good time to buy?”
The honest answer is that whilst the national headlines can sound uncertain, there are some very compelling reasons why many buyers are choosing to move right now — particularly in wonderful market towns such as Midhurst.
Across the UK, the property market has experienced a period of adjustment following higher interest rates and wider economic uncertainty. However, recent reports are showing increased buyer activity returning to the market as mortgage products improve and confidence gradually strengthens.
Importantly, buyers today are often finding they have something that was much harder to achieve during the frantic post-pandemic market:
More choice
Greater negotiating power
Less intense competition
More realistic pricing from sellers
For many purchasers, that creates genuine opportunity.
Here in Midhurst, demand continues to remain resilient because of what the area offers beyond just property itself. Buyers are still heavily attracted to the combination of:
Outstanding countryside
South Downs National Park access
Excellent schools
Quality independent shops and restaurants
Easy access towards London and the south coast
A slower and more balanced lifestyle
What we are seeing locally at TAUK is that serious buyers are still very active — particularly for well-presented homes in desirable positions.
The key difference today is that buyers are behaving more carefully and analytically. The days of rushed decision-making and sealed bids on every property have softened. In many ways, that is actually healthier for the market.
Mortgage rates also appear to be stabilising compared with the volatility of previous years, and a number of industry analysts expect gradual improvement over time if inflation continues to ease.
Of course, timing the market perfectly is almost impossible.
The buyers who tend to succeed long-term are usually those who purchase the right home for their lifestyle and future plans, rather than trying to predict every movement in interest rates or prices.
One thing that remains consistently true in places such as Midhurst is that exceptional homes continue to attract strong interest. Character cottages, country houses, quality modern homes and properties with views or land remain highly desirable.
At TAUK, I am personally finding that buyers who were hesitant six months ago are now re-entering the market with renewed confidence, particularly as they realise waiting indefinitely can sometimes mean missing the right opportunity altogether.
For anyone considering a move in or around Midhurst, my advice would be:
Understand your finances clearly
Take advantage of increased property choice
Focus on long-term suitability
Move decisively when the right property appears
Property has always been a long-term investment first and foremost — and beautiful locations with enduring appeal tend to remain highly sought after regardless of short-term market cycles.
If you are considering buying, selling, or simply want an honest conversation about the local market, I would be delighted to help.
— Christian Budd
Personal Agent for TAUK
Latest Property Market Updates
April 2026 Update
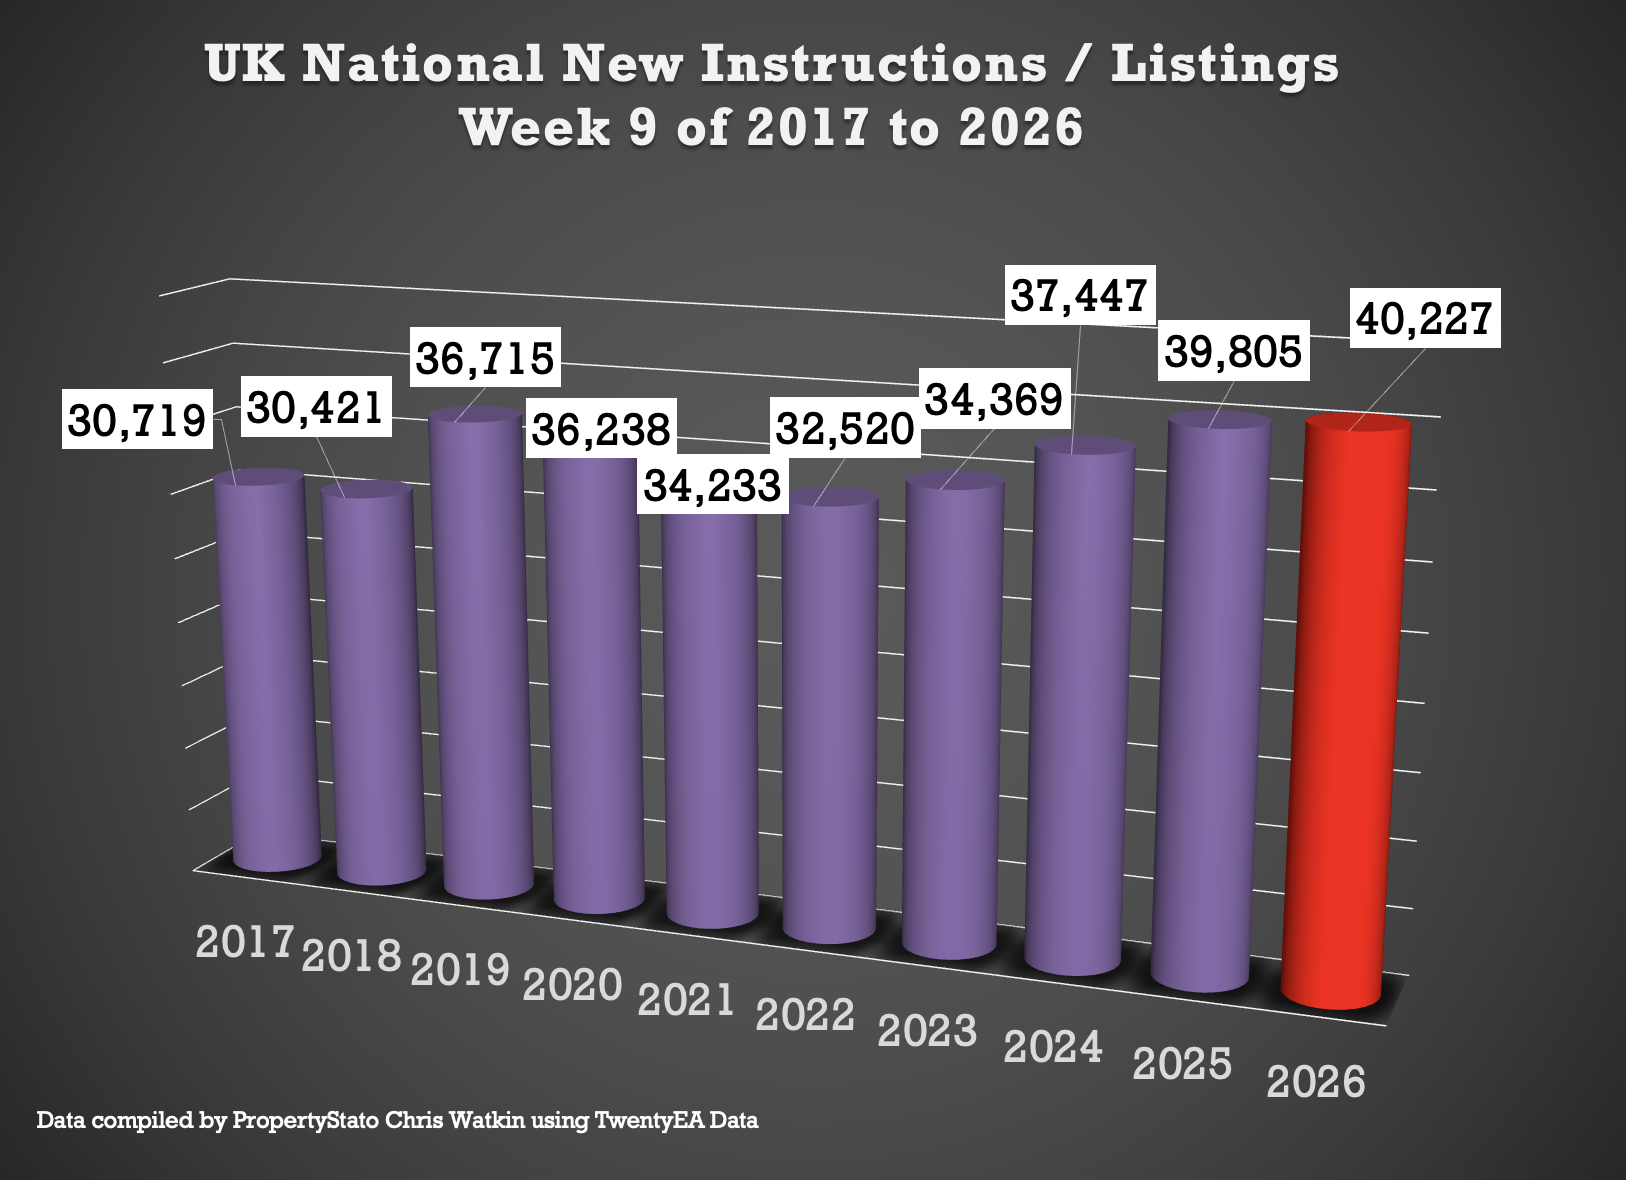
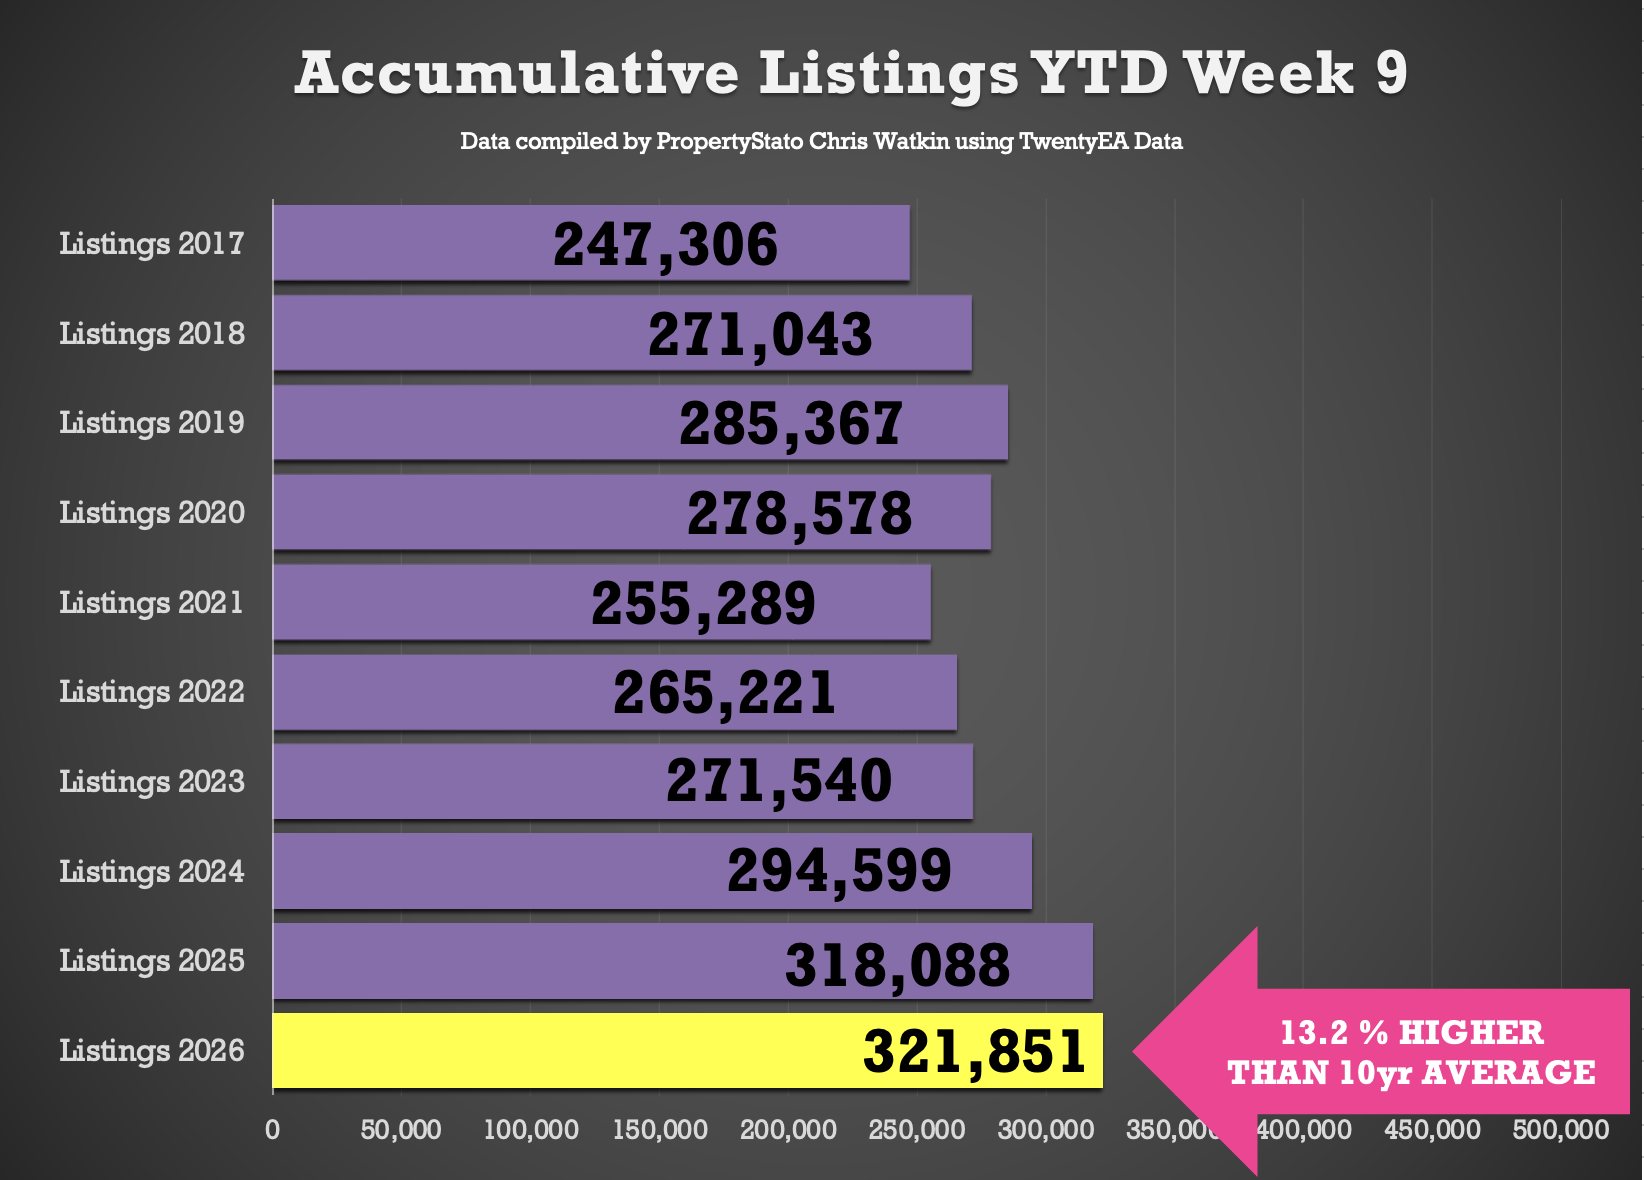
Listings YTD: 322,000 new properties have come to market, slightly ahead of 2025 levels and significantly above long-term averages.
Sales Agreed: 219,000 homes sold subject to contract, showing resilience despite wider economic conditions.
👉 What this means locally:
In Midhurst and surrounding villages, well-presented homes continue to attract strong interest, particularly those priced correctly from launch.
March 2026 Update
Ongoing market stability with steady buyer demand
Increased sensitivity to pricing
Strong competition for well-positioned homes
👉 Local insight:
Homes in prime village locations such as Lodsworth, Cocking, and Easebourne continue to outperform the wider market.
What This Means for Sellers
If you’re thinking of selling in Midhurst or the surrounding villages:
Pricing strategy is more important than ever
First impressions (photography, marketing) are critical
Demand is still strong for the right homes
Well-positioned properties are still achieving excellent results.
What This Means for Buyers
For buyers, the current market presents opportunity:
More choice compared to recent years
Greater negotiating power in some cases
Continued competition for the best homes
Acting decisively remains key for desirable properties.
Local Property Expertise in Midhurst
As a Personal Agent for TAUK, I provide tailored advice, local knowledge, and a hands-on approach to selling property across Midhurst and the surrounding villages.
Thinking of Selling or Buying?
If you would like an up-to-date valuation or advice on the Midhurst property market, get in touch today.
👉 Christian Budd – Personal Agent for TAUK
Property Blog
1st April 2026
Lawyers file £1.5bn legal claim against Rightmove on behalf of estate agents –
Nationwide: Iran war likely to impact on the UK housing market
13th March, 2026
Information taken from Property Industry Eye
🟩 Listings YTD
322k new properties have come onto the market YTD , 1% ahead of 2025, 9% above 2024, and 20% higher than the 2017–19 average.
🟩 Gross Sales YTD
219k UK homes sold STC YTD , 5.7% lower than 2025, 9% higher than 2024 and 18% above pre Covid norms.
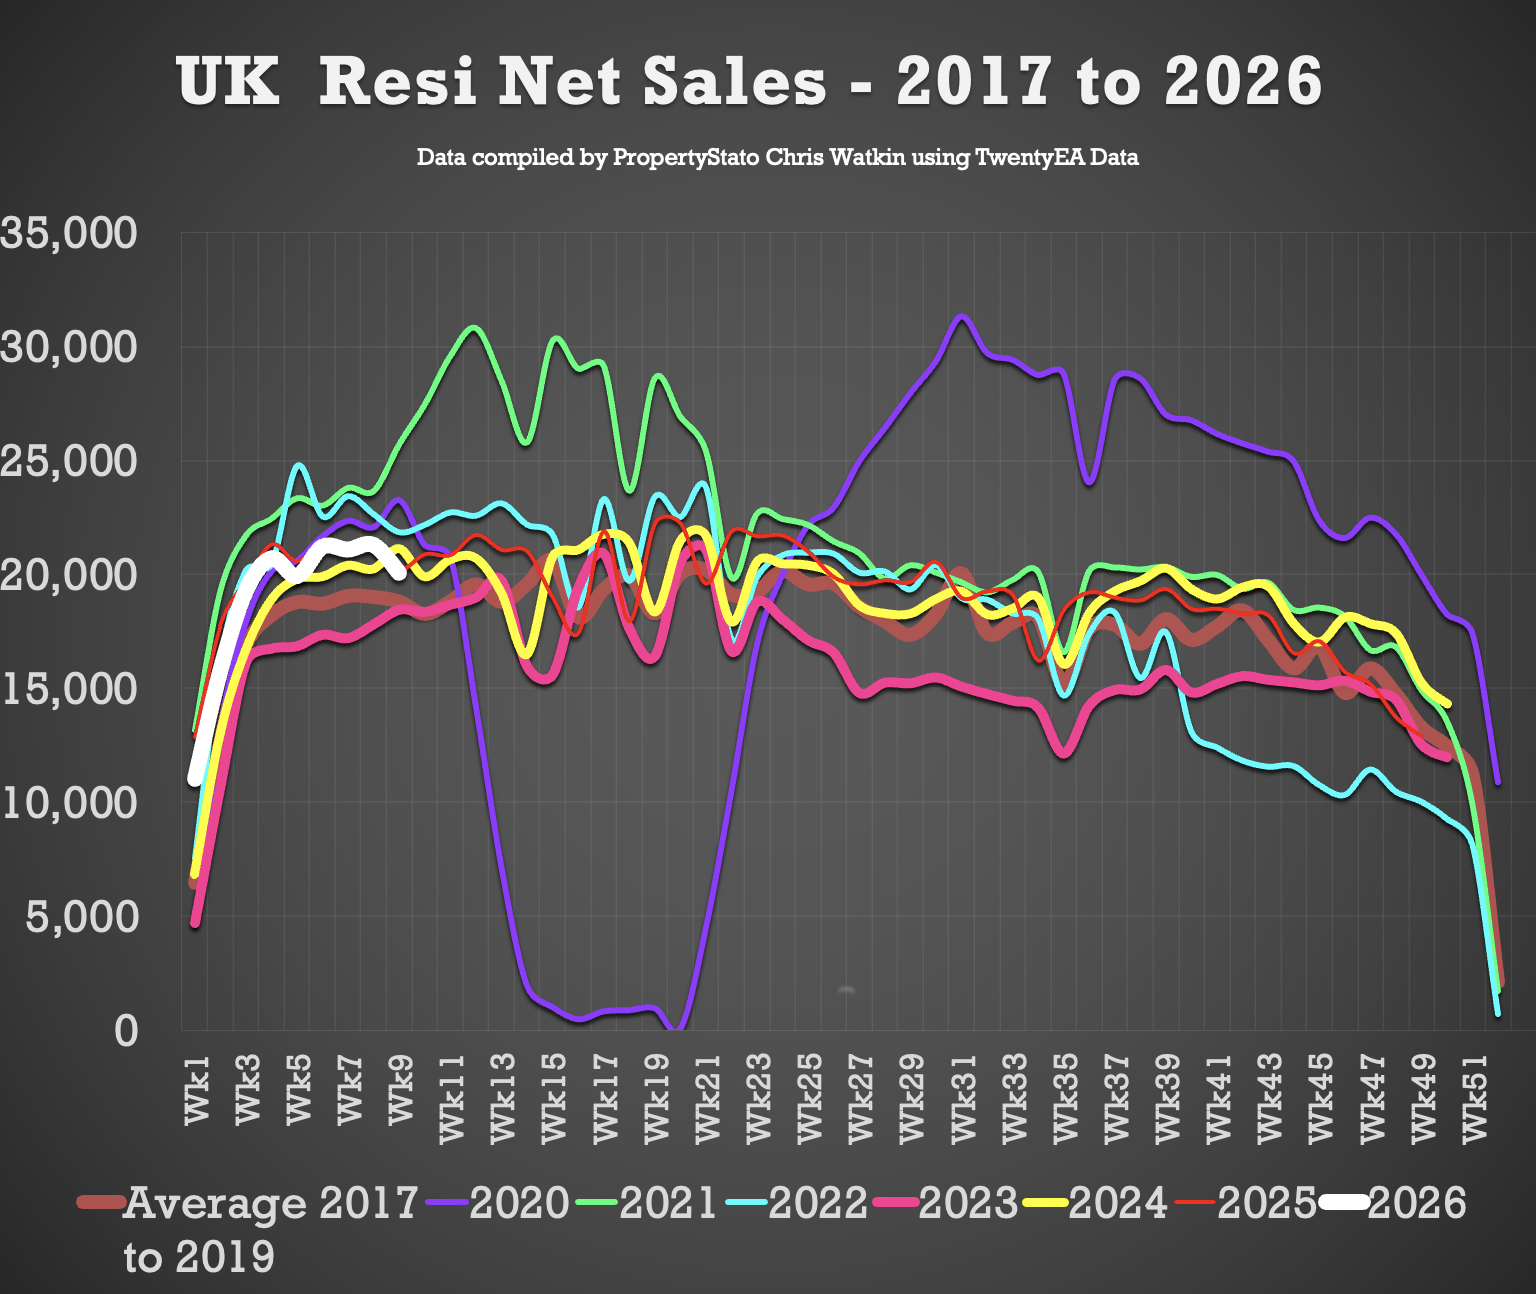
🟩 Net Sales YTD
171k UK net home sales YTD (Net Sales being Gross sales less Fall Throughs). 4.5% lower than 2025, 8.6% ahead of 2024, 25.3% ahead of 2023 and 15% above the 2017–19 average.
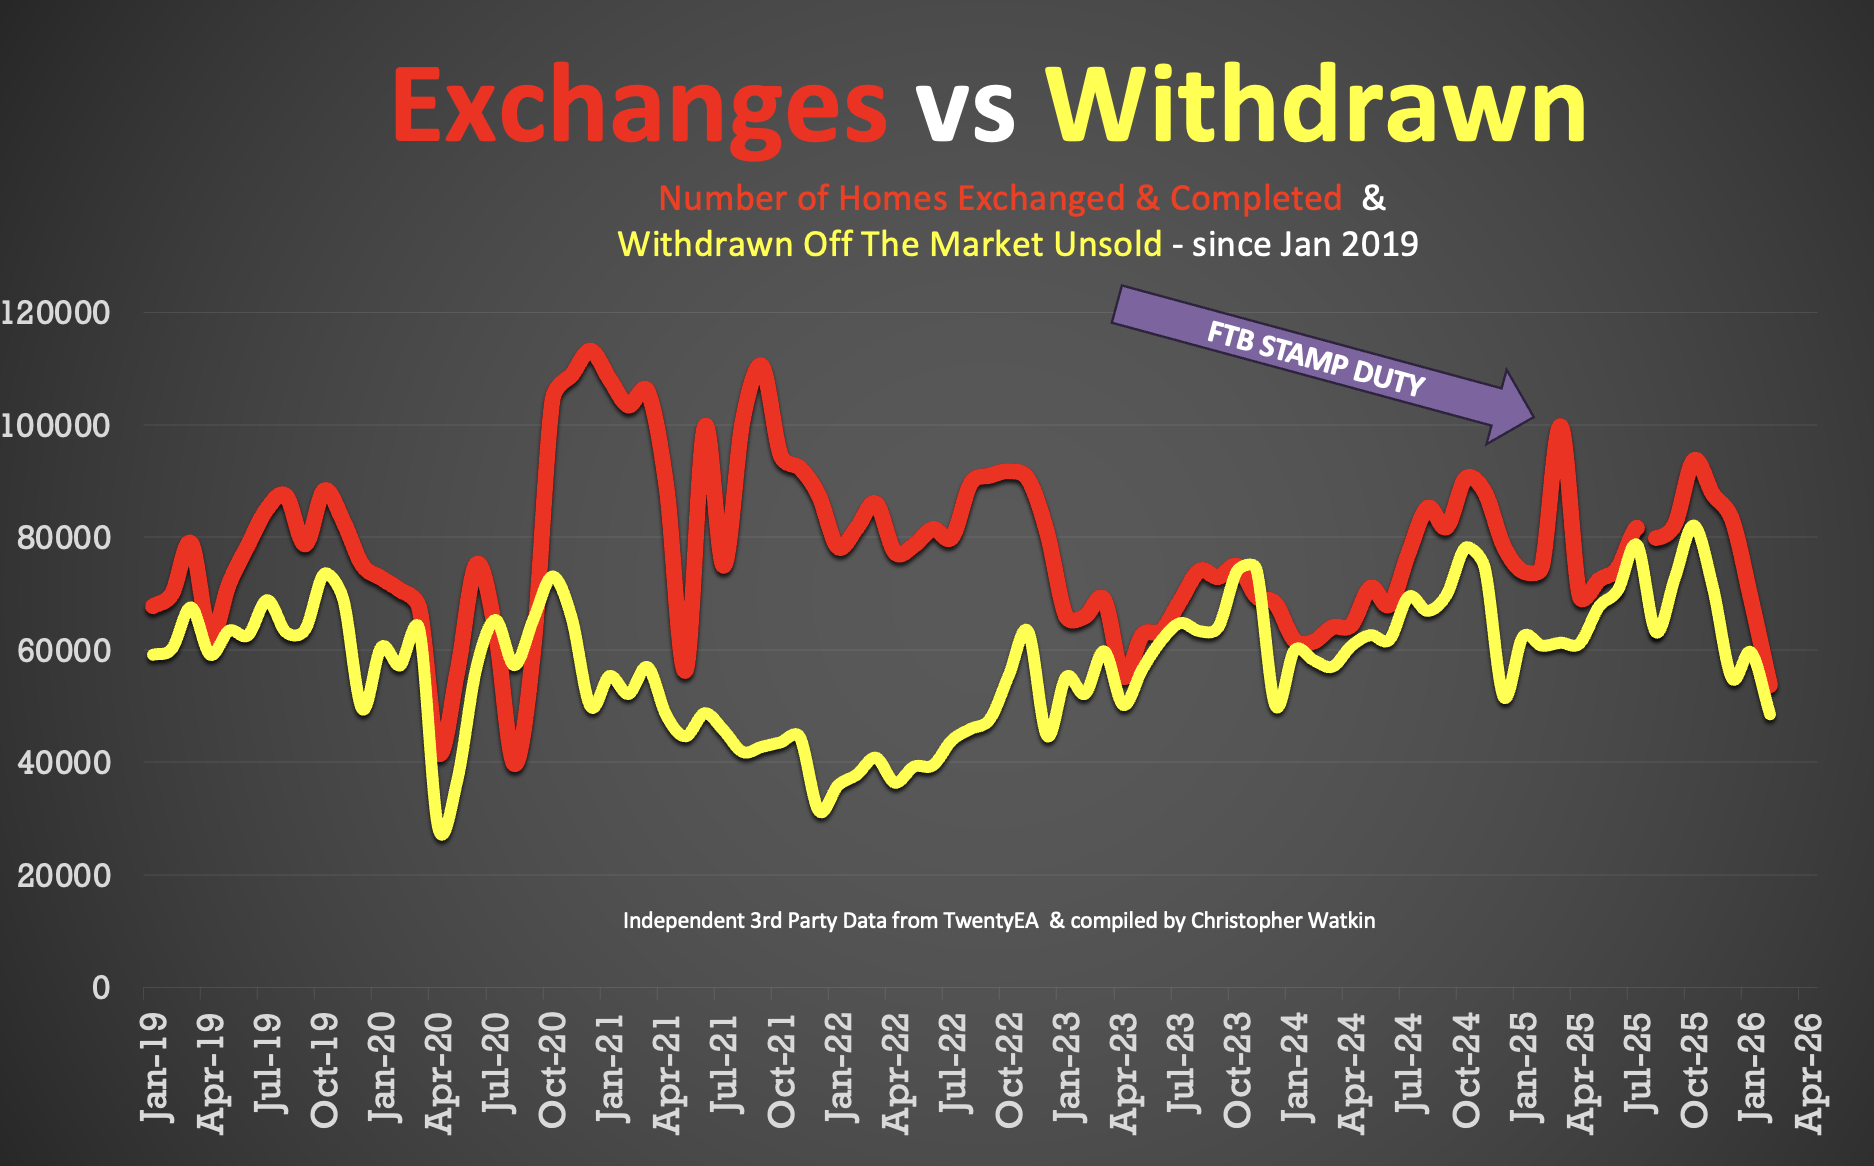
🟥 Overvaluing
47.5% of the homes that left UK Estate Agents books in February were withdrawn unsold. Main cause – blatant overvaluing supported by long sole agency agreements of 20+ weeks.
Detailed Breakdown …
✅ New Listings
+ 40.2k new properties came onto market this week (up as expected & inline with wk 9 long term trends) from 36.8k last week.
+ 2025 weekly average: 30.6k.
+ 10-year week 9 average : 35.3k.
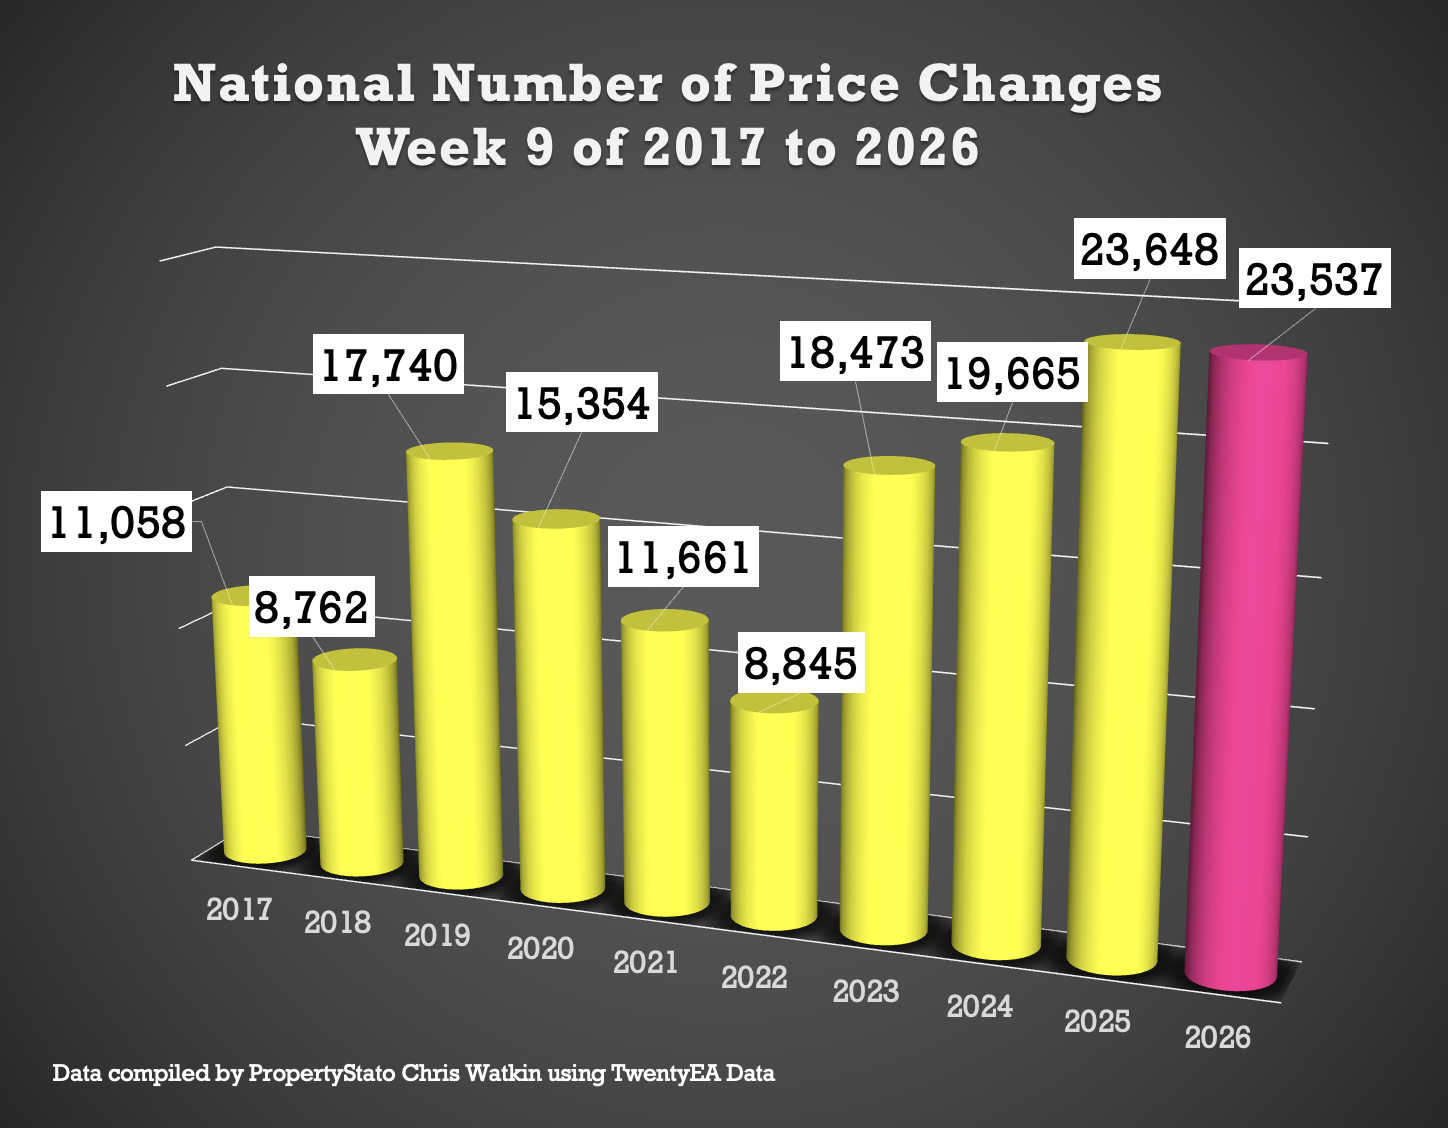
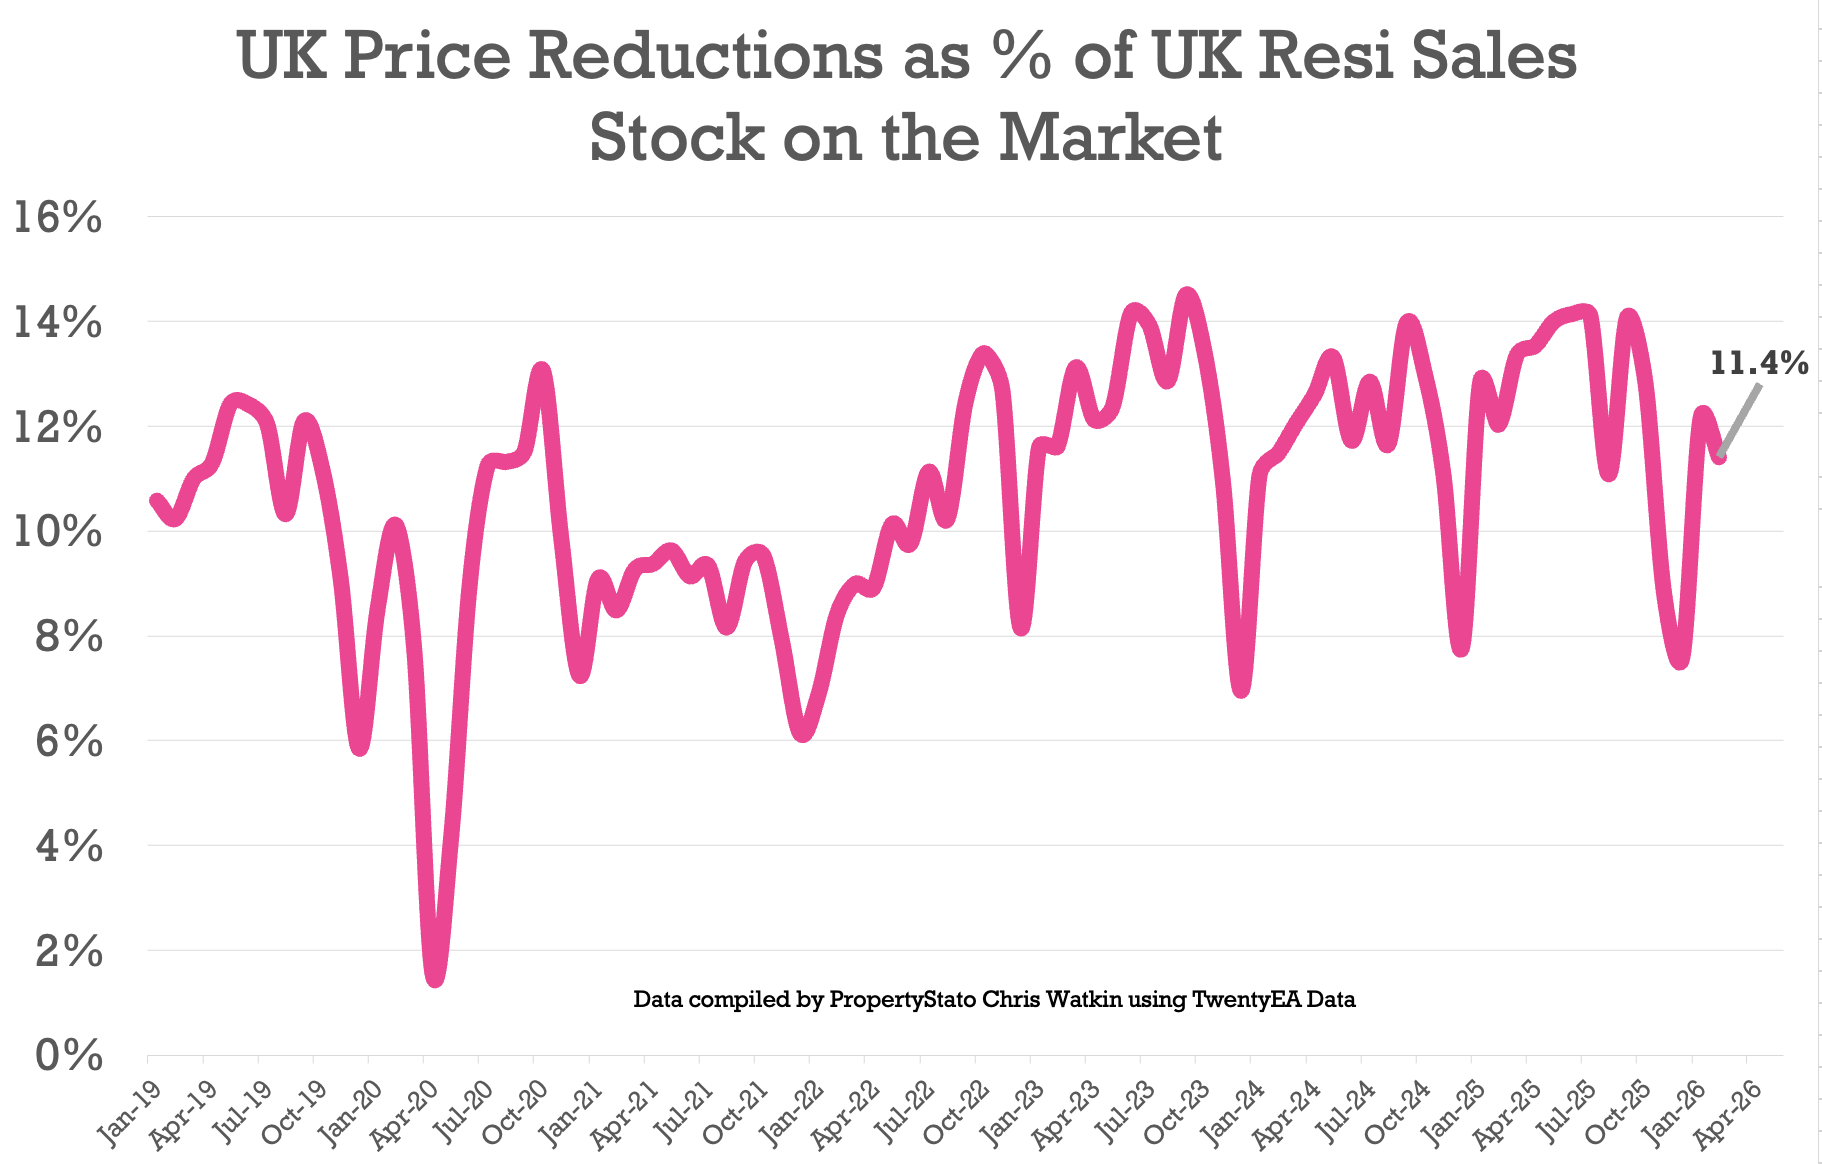
✅ Price Reductions
+ 25.5k reductions this week, up from 20.9k last week
+ 11.4% of resi homes for sale were reduced in February. Feb 25 – 12%. Feb 24 – 11.5%
+ 2025 average was 12.8%, versus the 6-year long-term average of 10.7%.
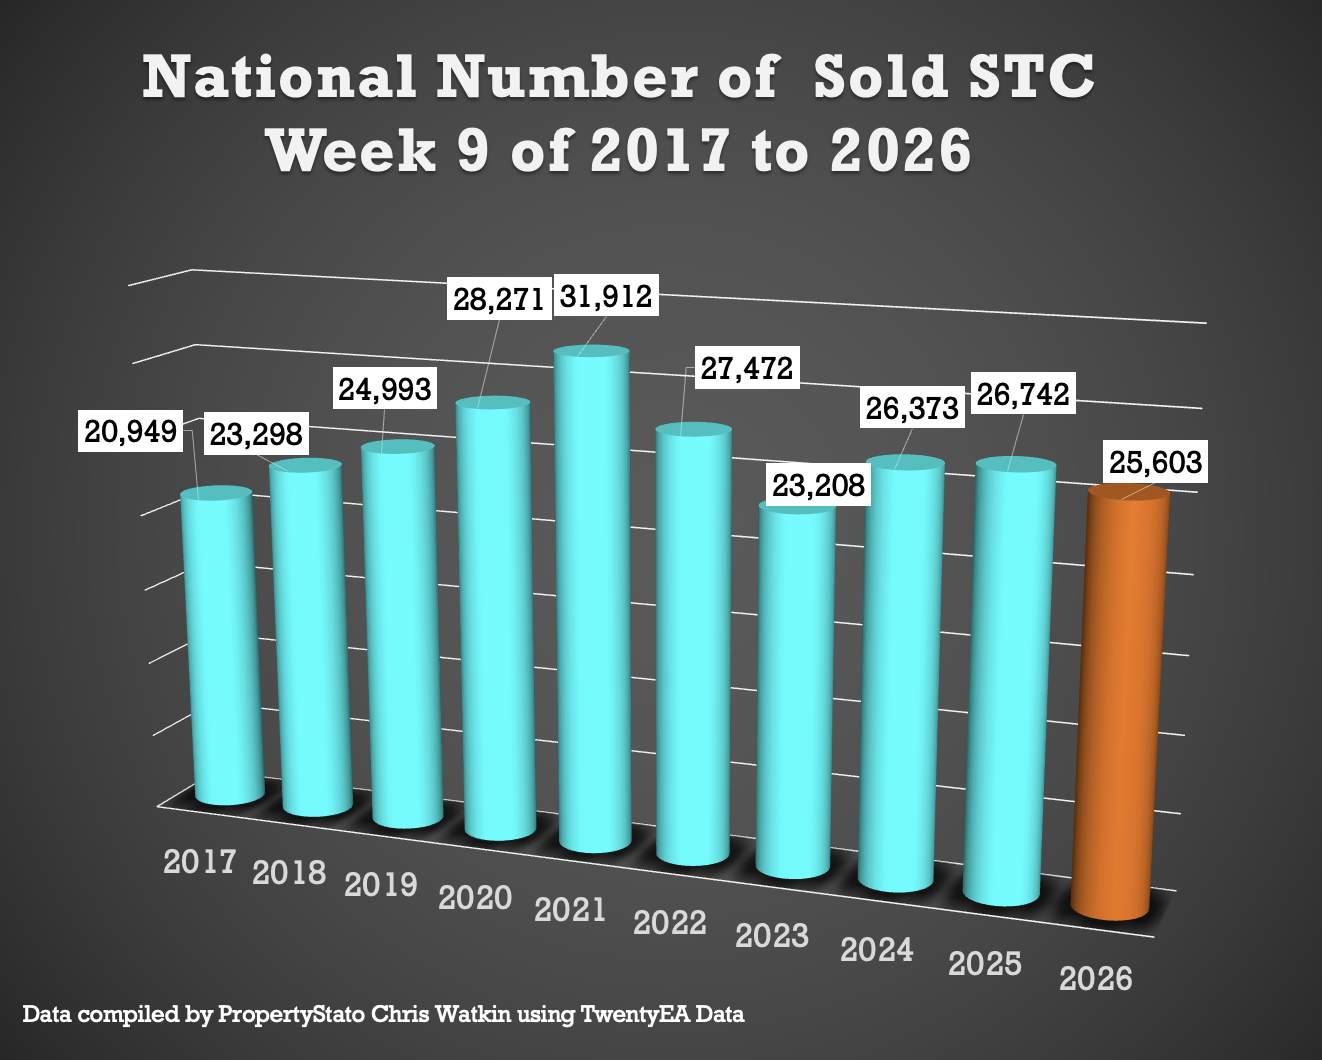
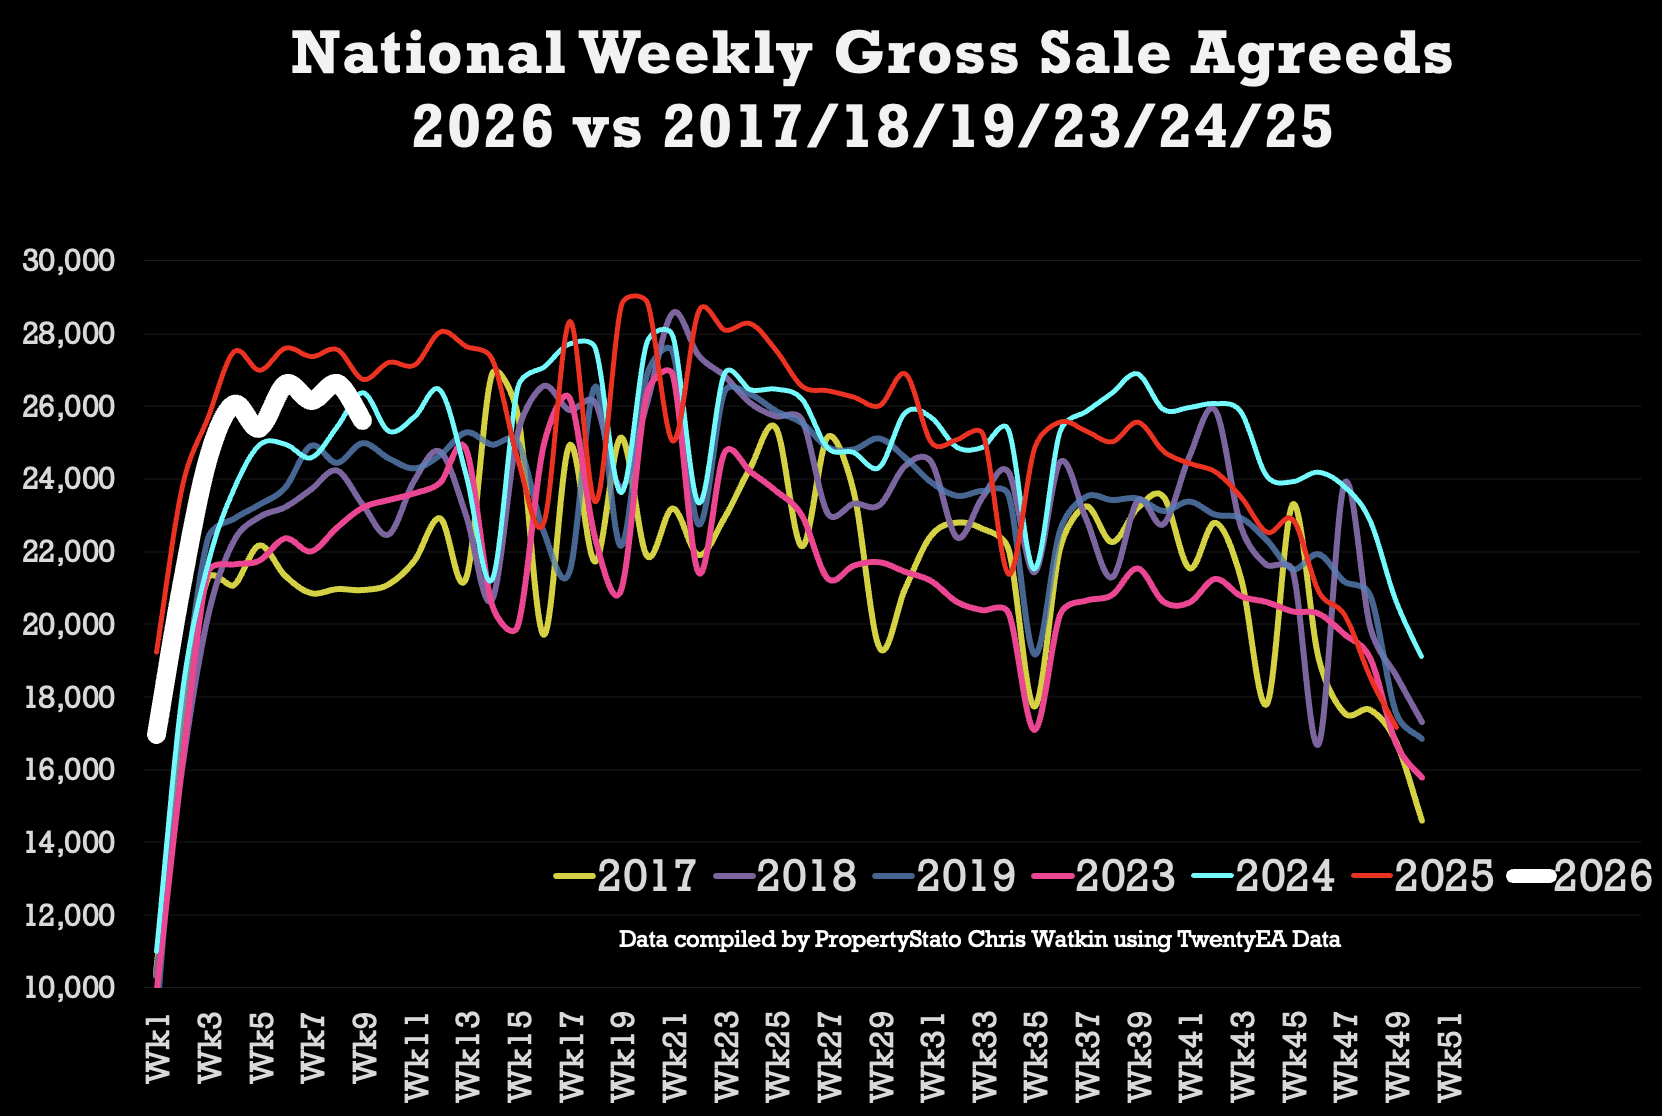
✅ Sales Agreed
+ 25.6k homes sold stc this week 9, down slightly from 26.6k last week.
+ Week 9 average (for last 10 years) : 25.9k
+ 2026 weekly average : 24.2k.
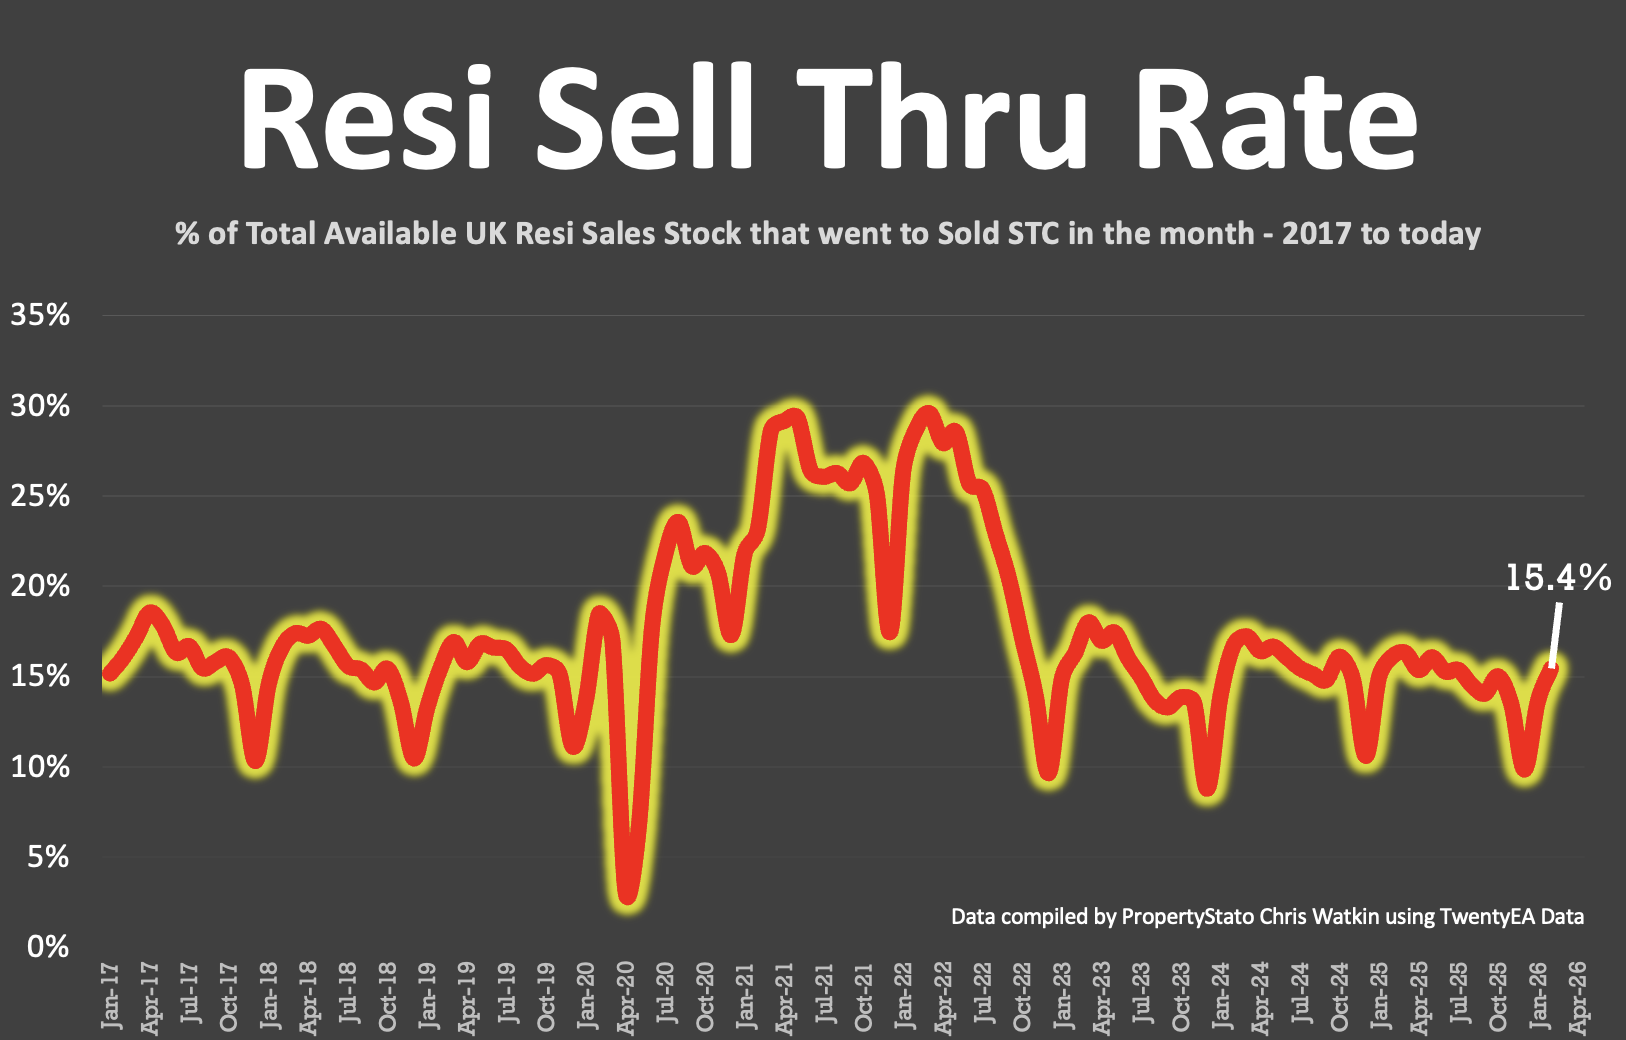
✅ Sell-Through Rate
+ 15.4% of homes on agents’ books went SSTC in February ’26. (Feb ’25 – 16.1% / Feb ’24 – 16.7%)
+ Pre-Covid average: 15.5%.
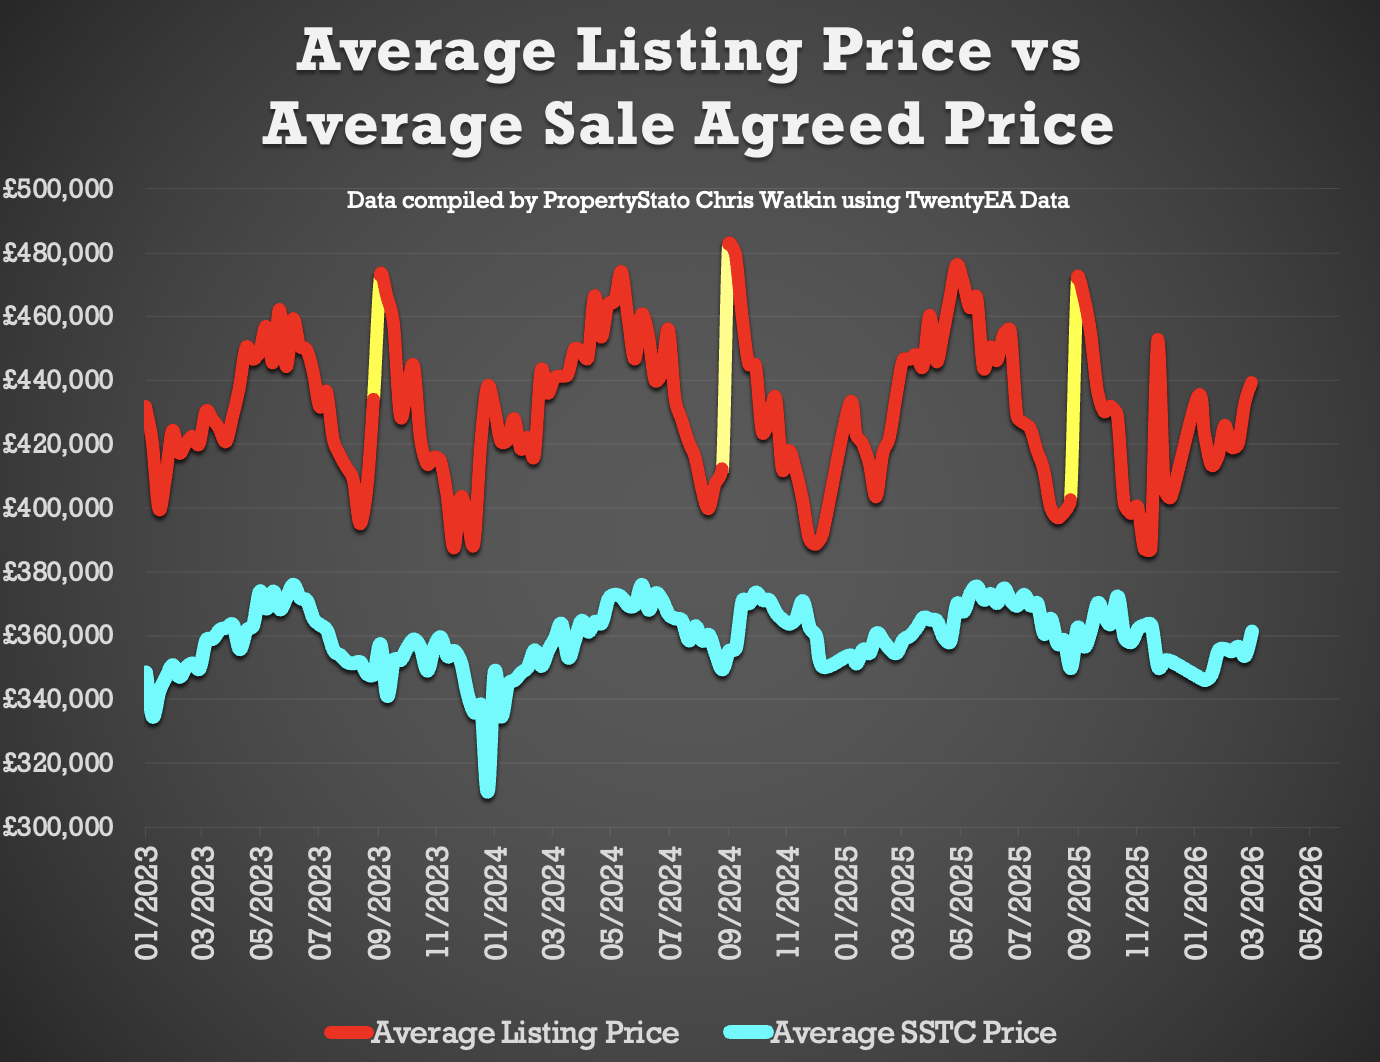
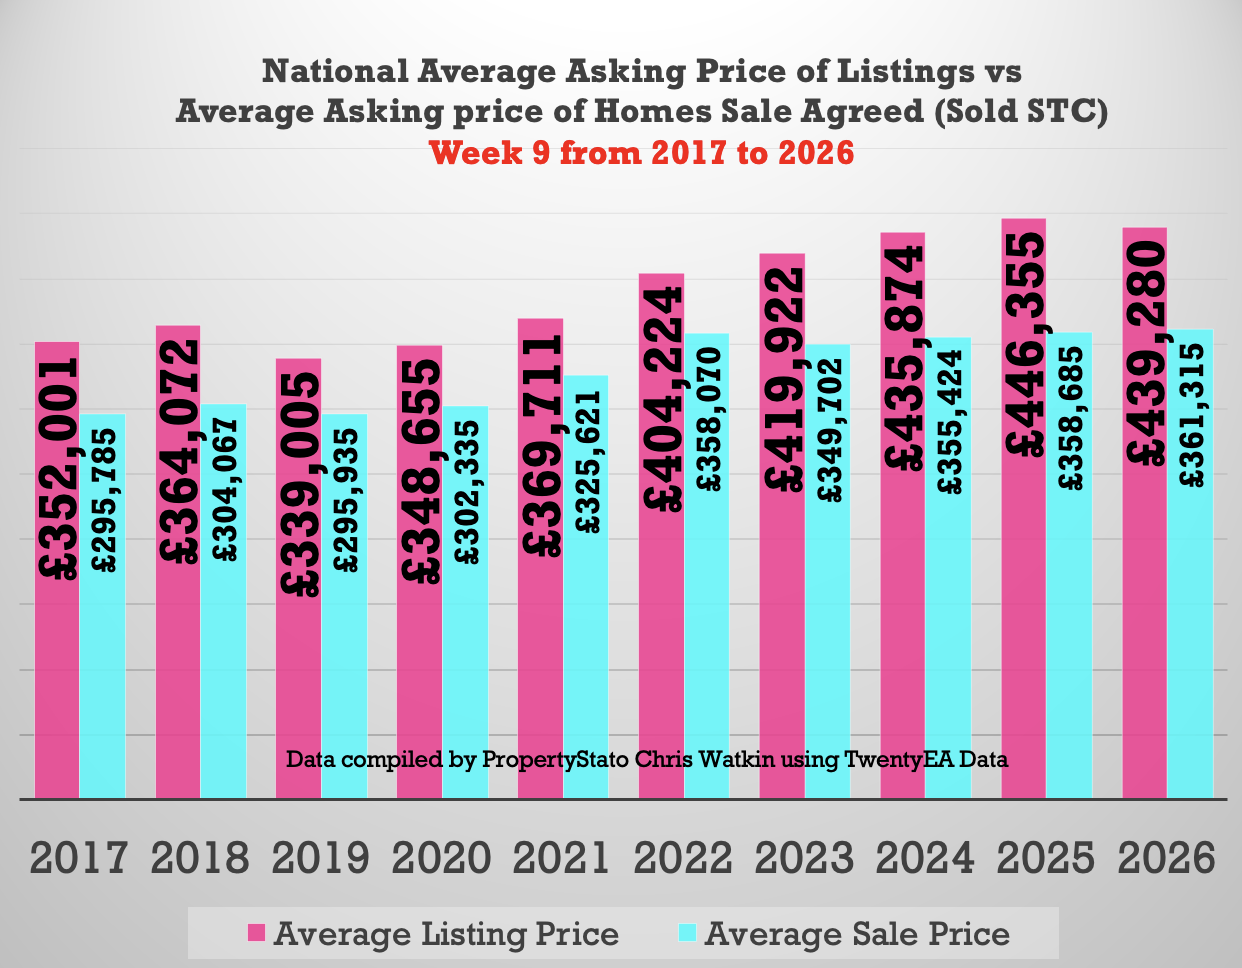
✅ Price Difference between Listings & Sales
+ 21.6% difference (long term 10 year average is 16% to 17%). (£439k ave Listing Ave Asking price vs £361k Sale Agreed ave. asking price).
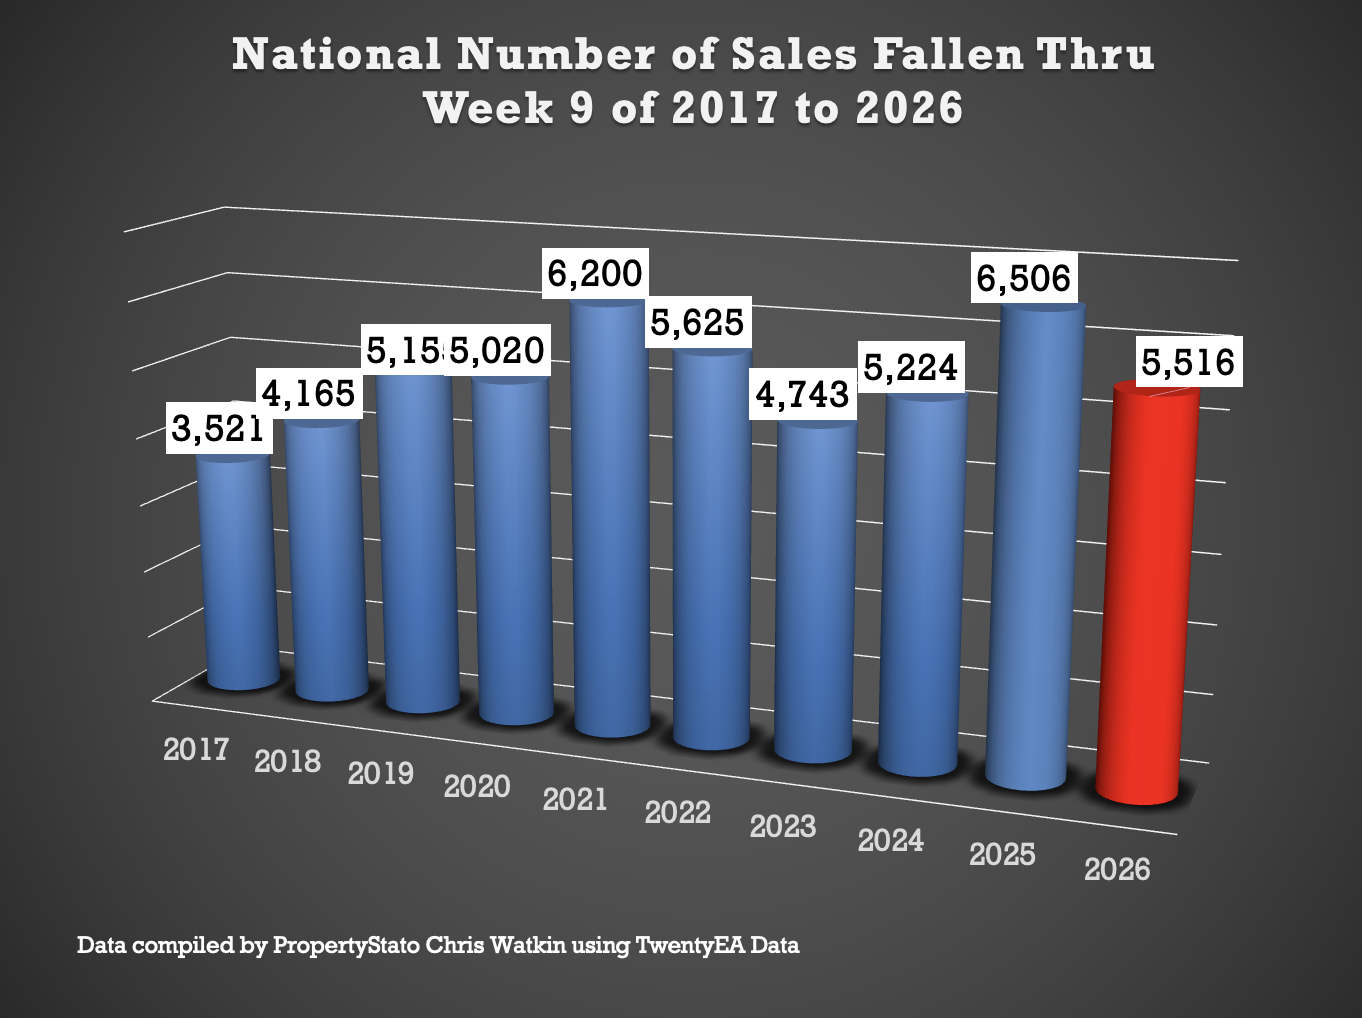
✅ Fall-Throughs
+ 5,516 fall-throughs last week (pipeline of 434k home Sold STC).
+ Weekly average for 2025: 6,100.
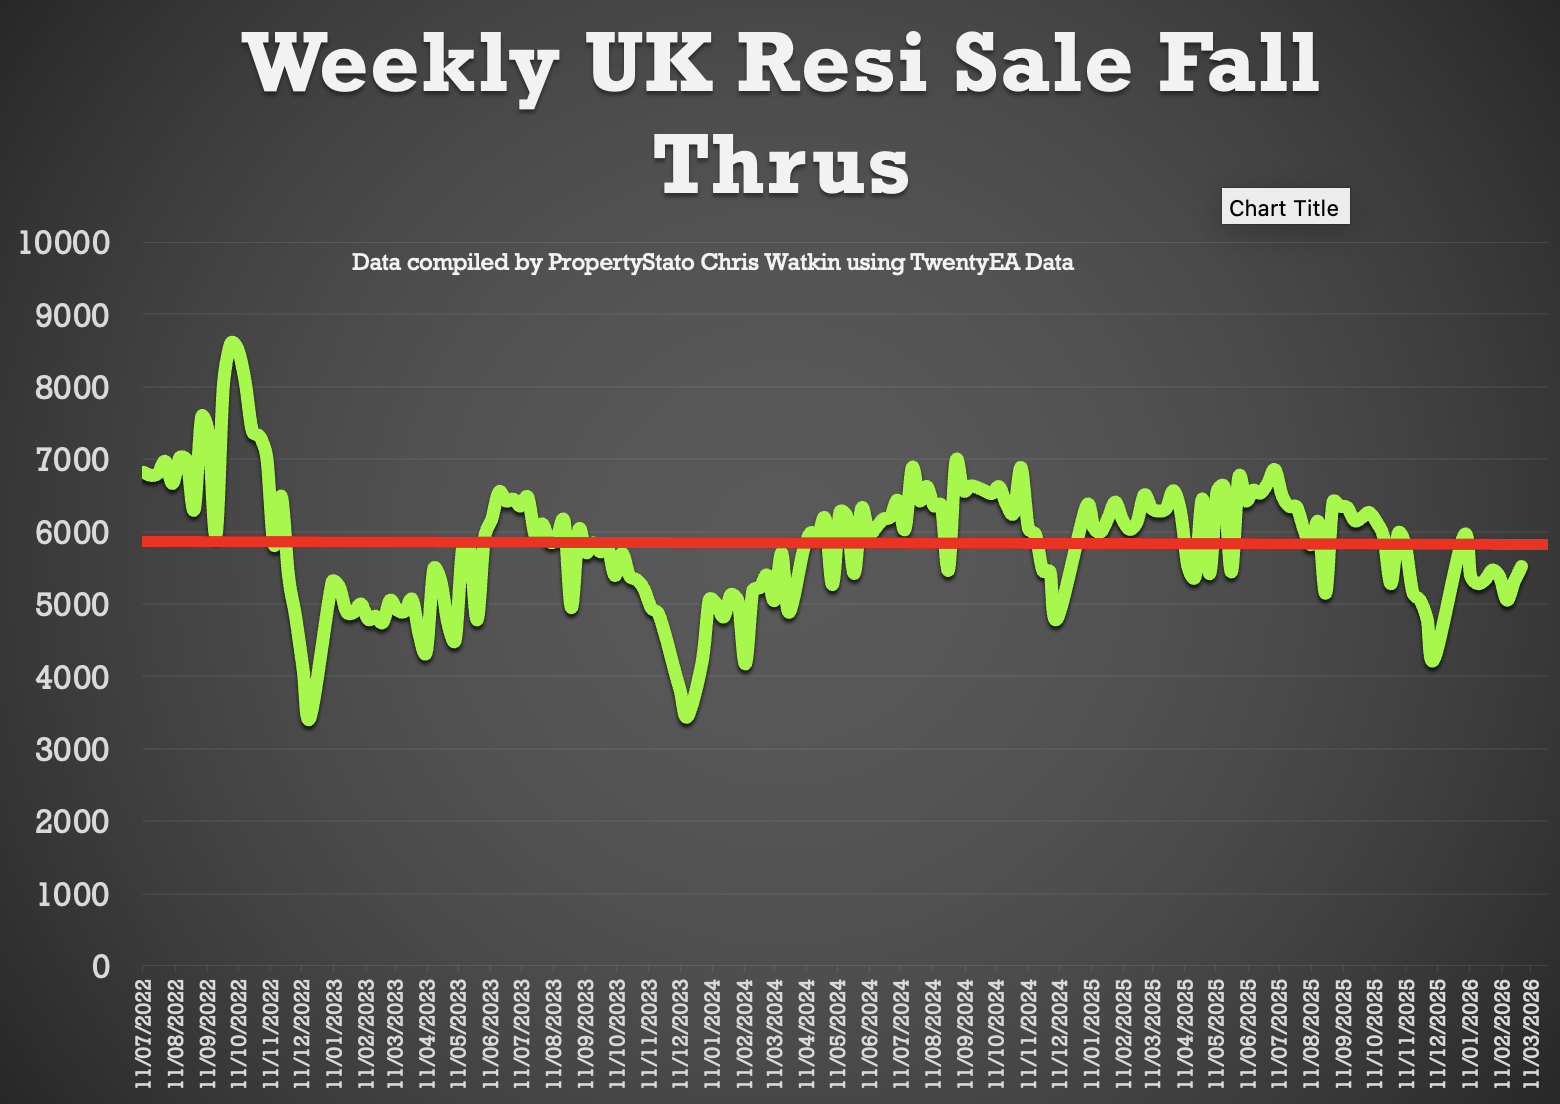
+ Fall-through rate (Fall thru expressed as a % of the Gross sales that week): 21.5%, down from 19.9% last week.
+ Long-term average: 24.2% (post-Truss chaos saw levels exceed 40%).
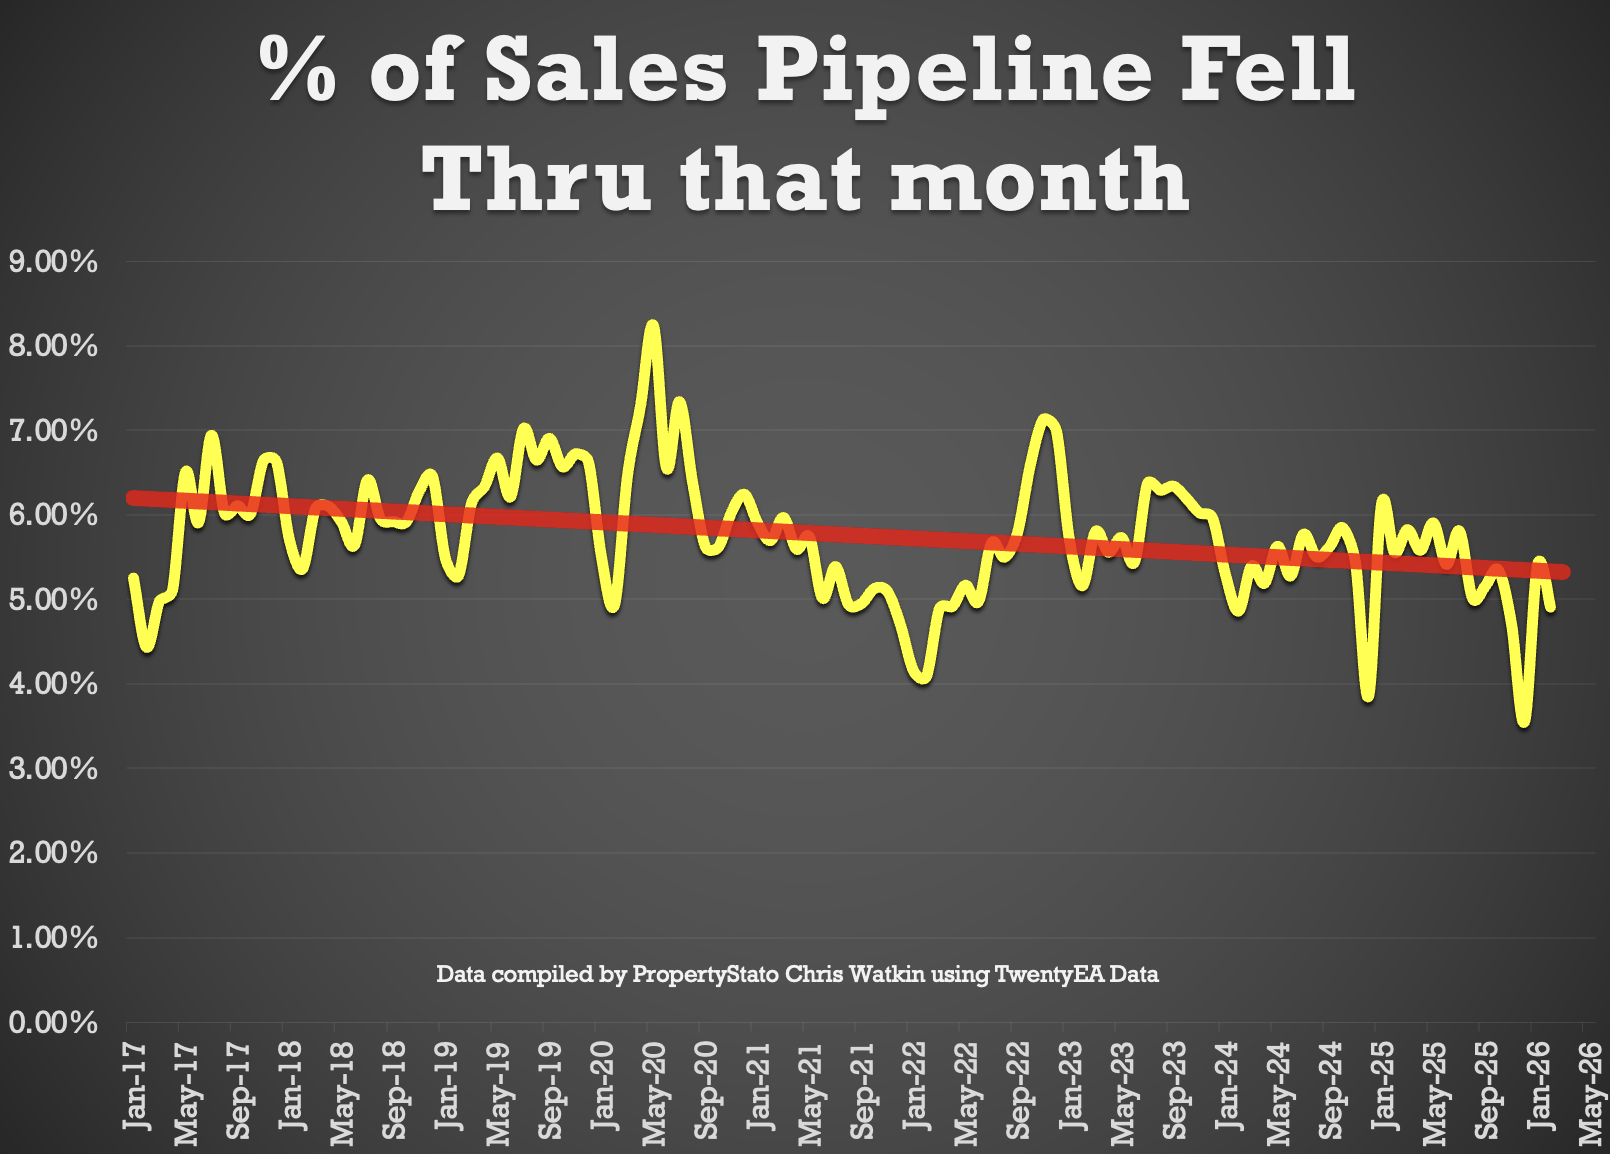
+ 4.9% of all the sales agreed in Estate Agent’s Sales pipelines fell thru in February 2026. 2025 average – 5.3% & 10 year average – 5.8%).
✅ Net Sales
+ 20k Net Sales, up slightly from 21.3k last week
+ Ten-year Week 9 average: 20.7k.
+ Weekly average for 2026: 19k.
+ Weekly average for the whole of 2025: 18.8k.
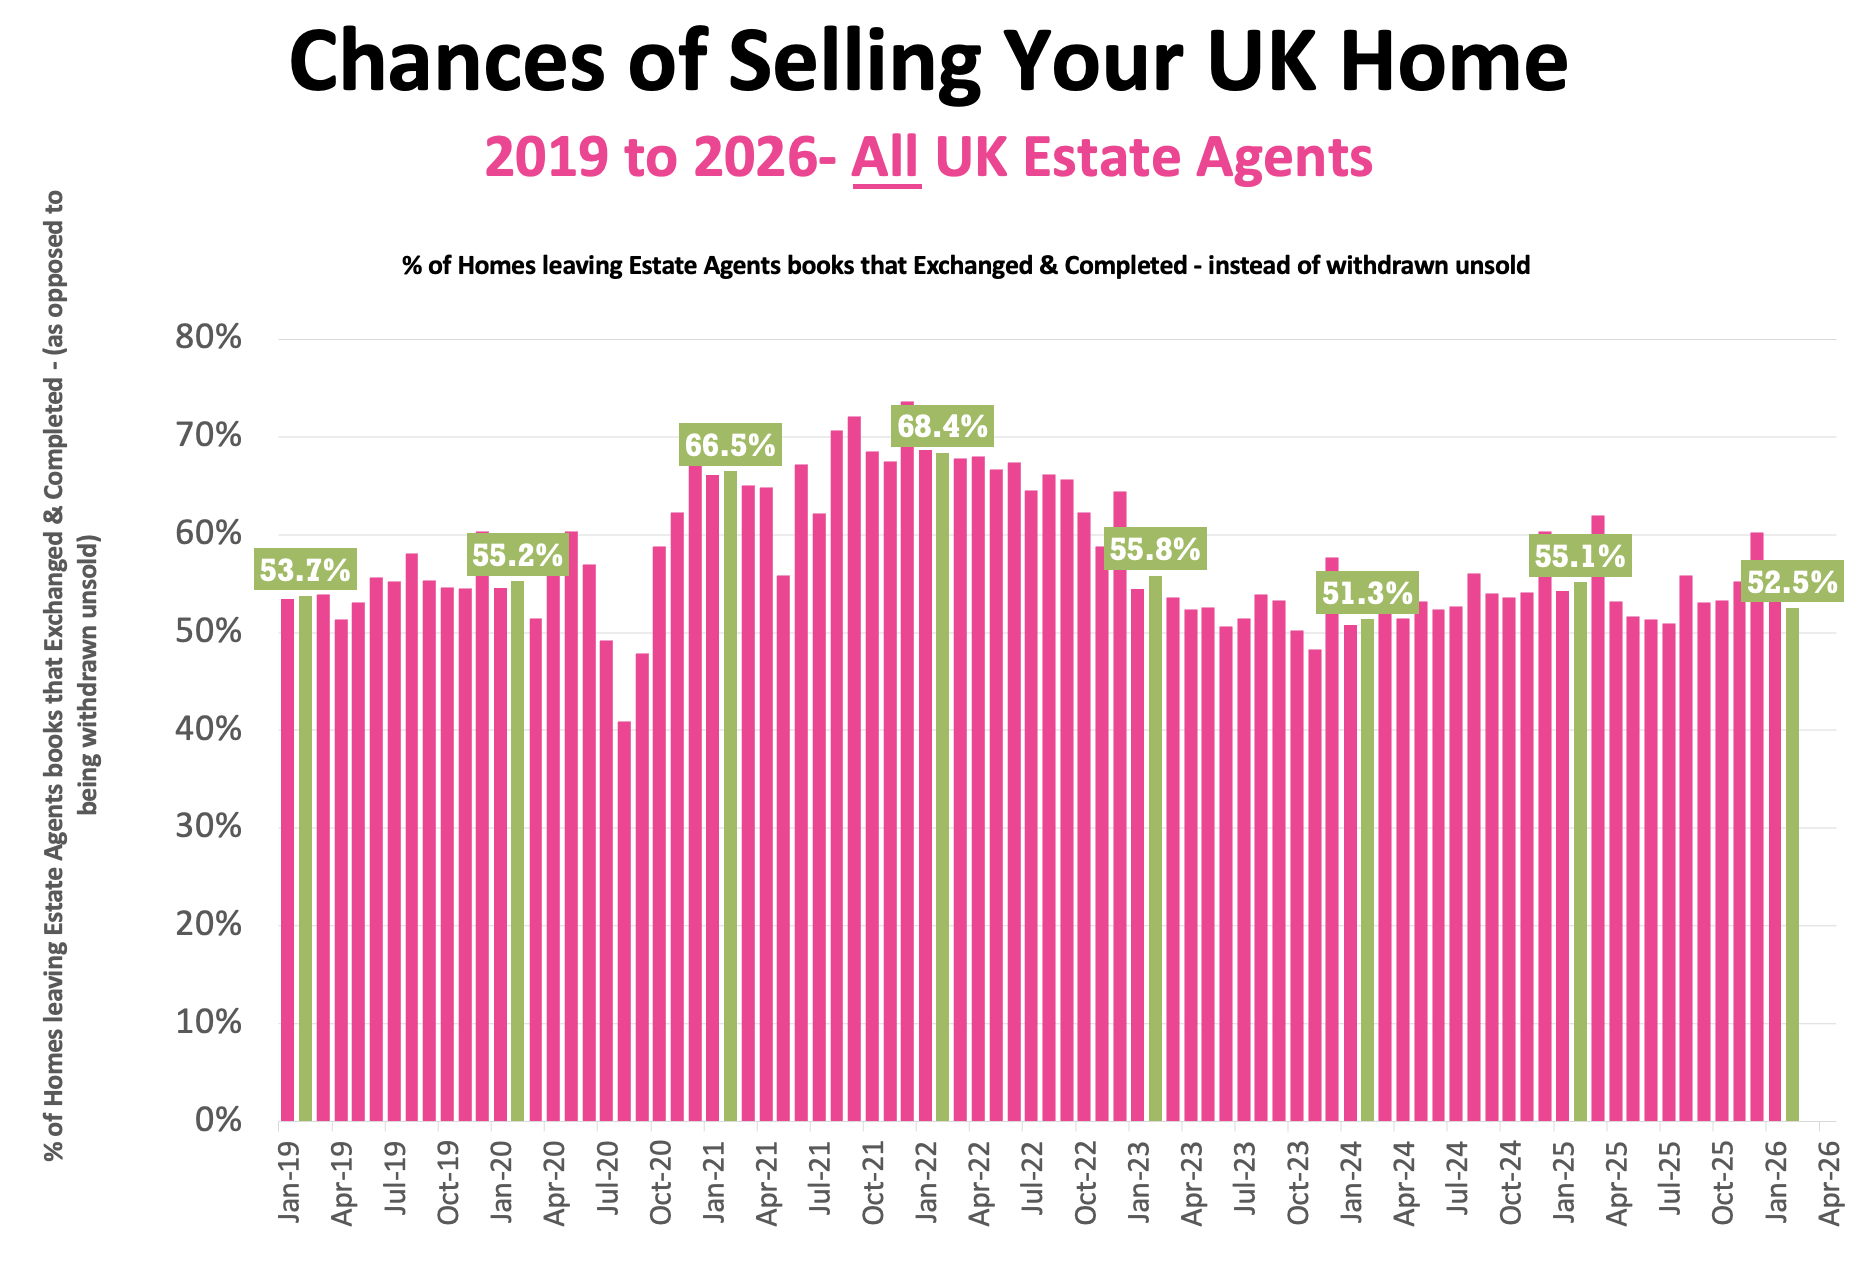
✅Probability of Selling (% that Exchange vs withdrawal)
+ Feb ’26 Stats : 52.5% of homes that left agents’ books exchanged & completed in Feb. (Note this figure will change throughout the month as more Feb stats come in).
+ 57.6% is the 7 year average (which includes the crazy years post lockdown 18 months).
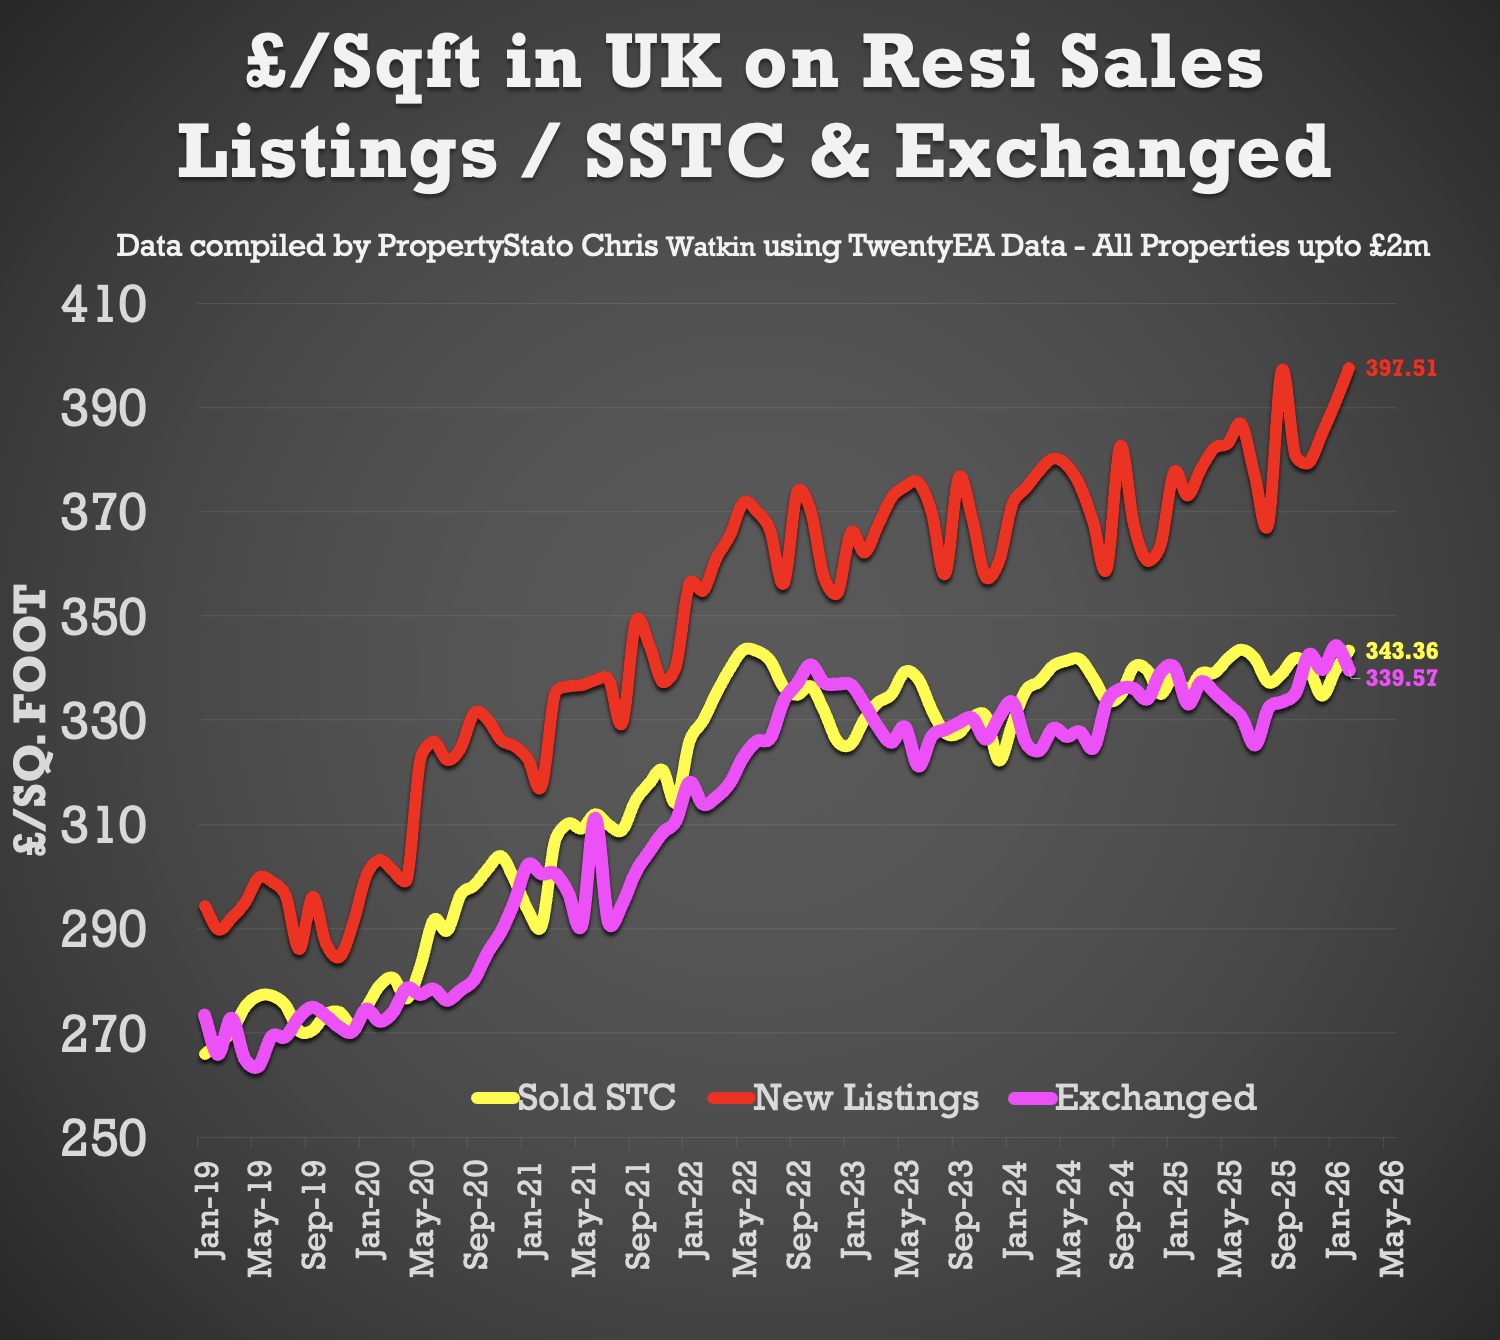
✅ House Prices (£/sq.ft)
+ February ’26 agreed sales averaged £343.36 per sq.ft. 2.3% higher than 12 months ago (£335.63) and 18.2% than 5 years ago (£290.43). The £/sqft at sale agreed matches the HM Land Registry Index with a 98% accuracy, 5 months in advance. That is why it is so important.
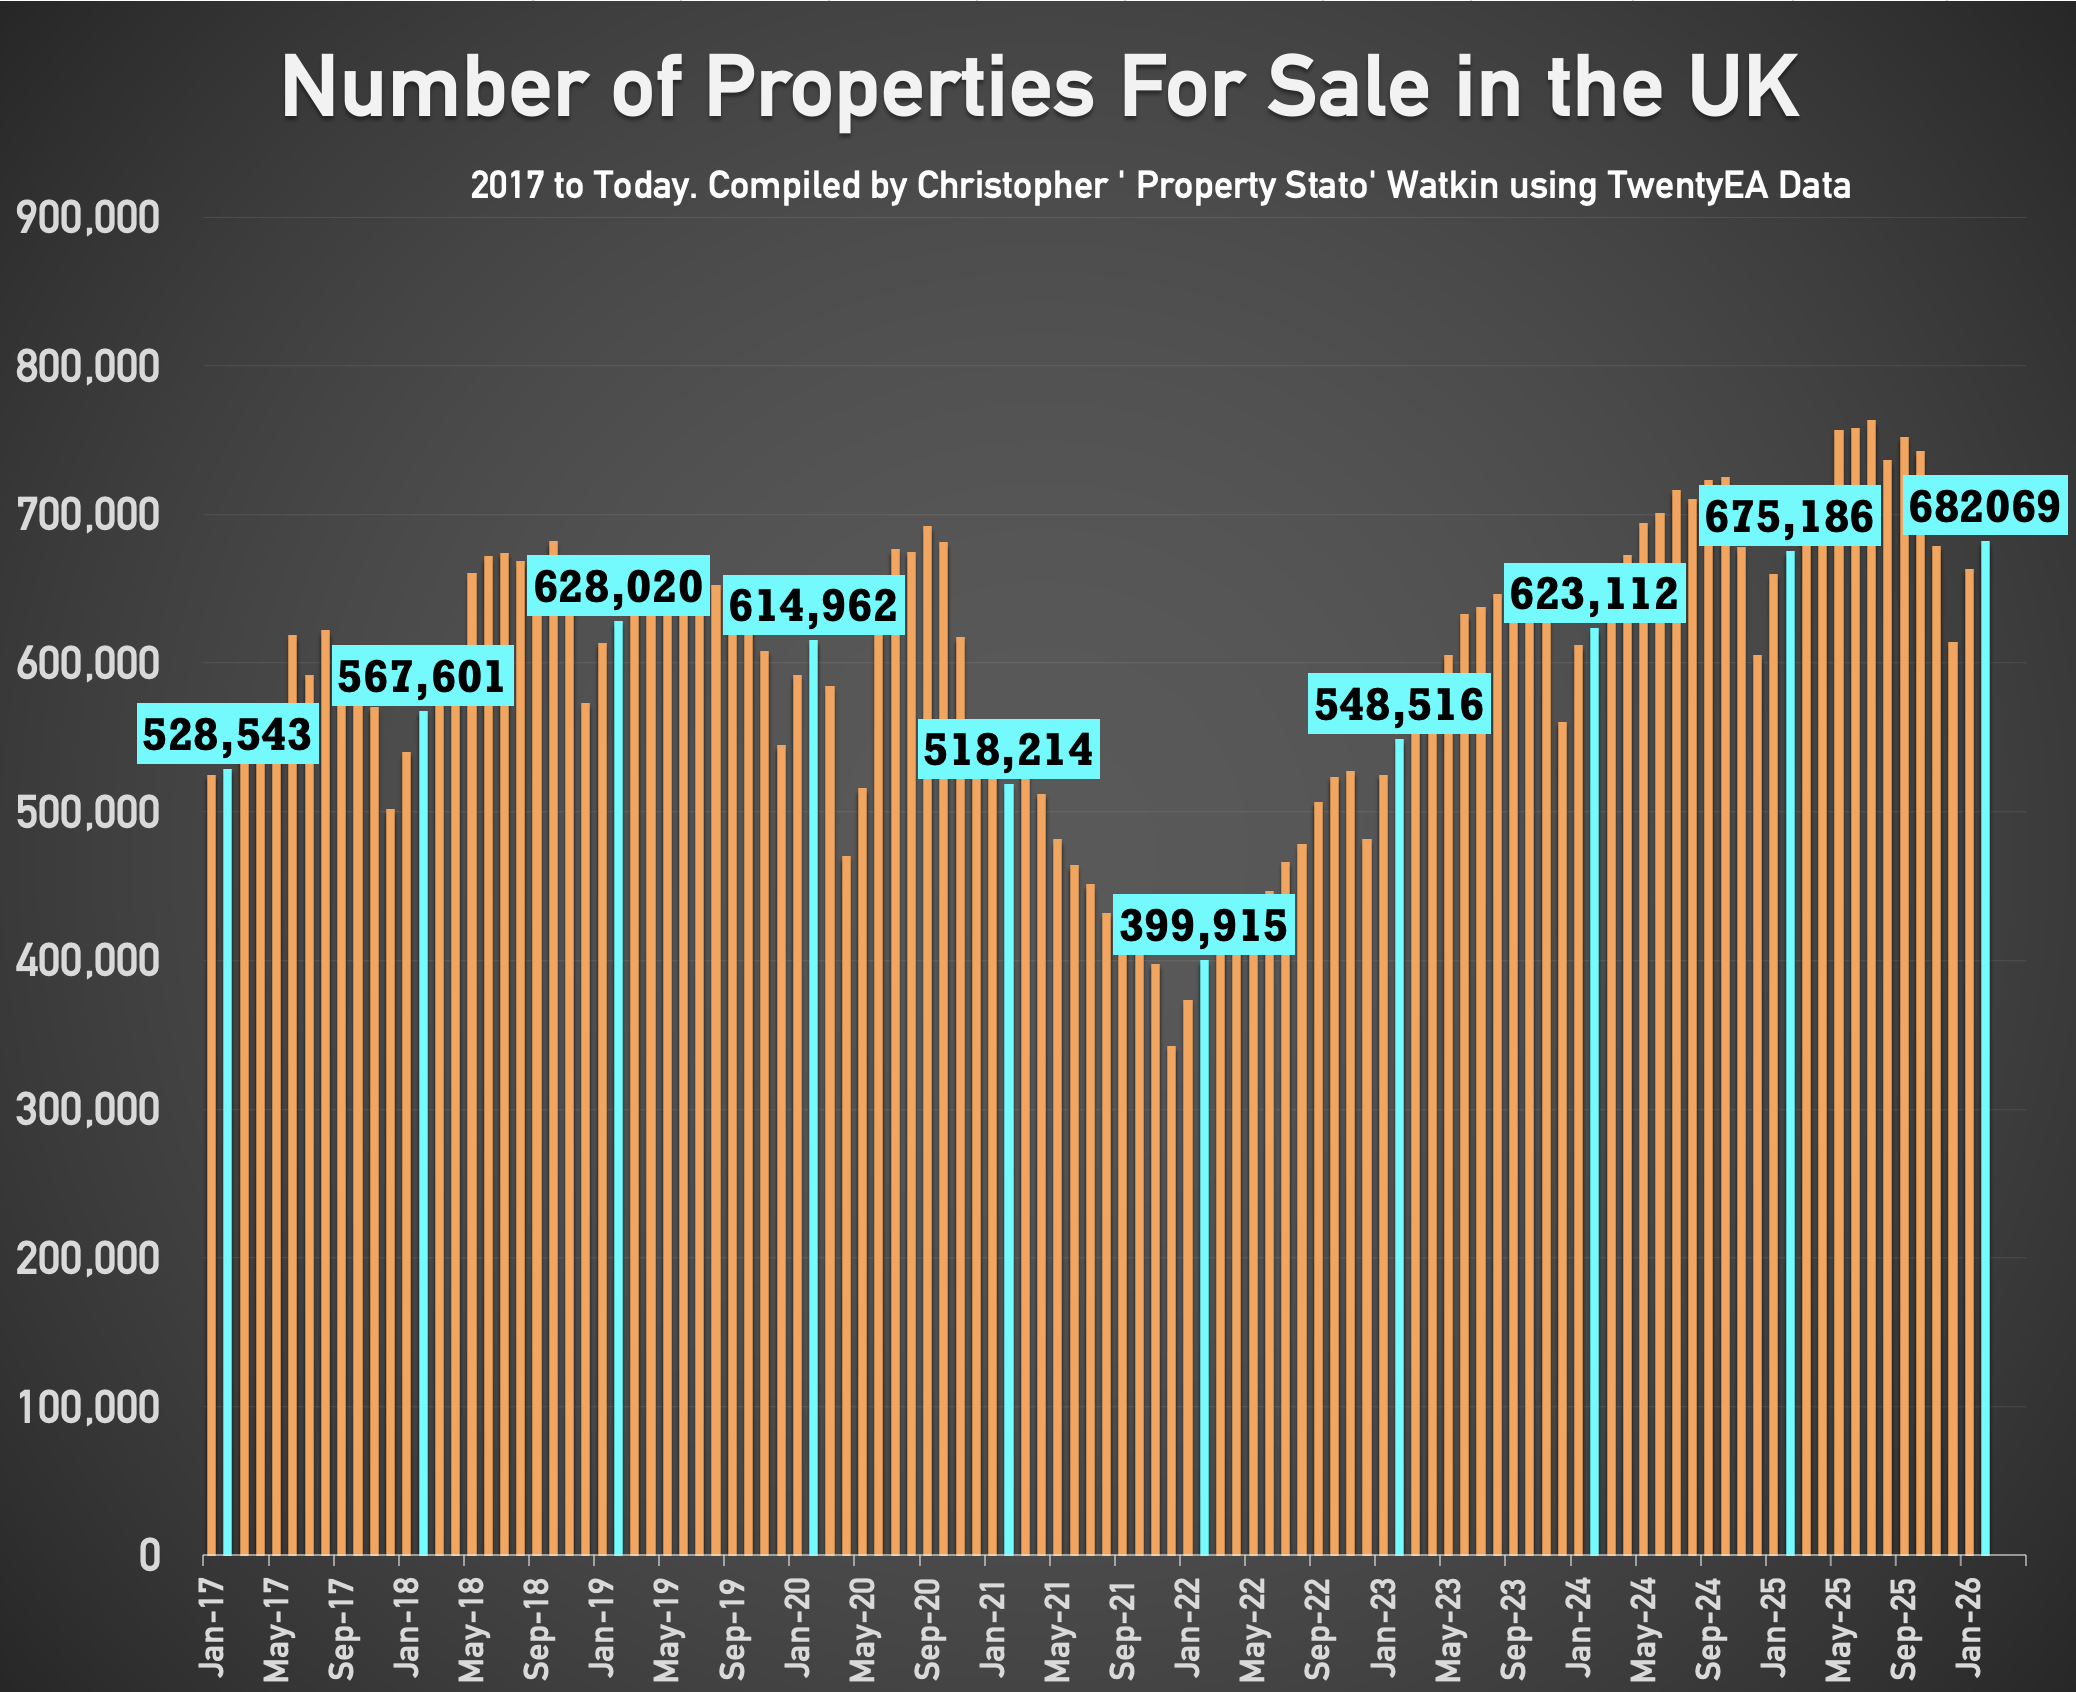
✅ Stock Levels
+ 682k homes on the market on the 1st of March ’26. (675k – 1st March 25)
+ 434k homes in agent’s sales pipeline on the 1st March 2026, slightly lower than 12 months ago on 1st March ’25 (444k).

✅ UK Rental Data
+ Average Rent in Feb 2026 – £1,711 pcm (£1,745 in Feb 25)
+ 305k UK Rental Stock available to rent in Feb 26 (310k in Feb 2025)
The prospect of lower mortgage costs may be getting further away due to the Iran conflict, Halifax has warned.
It comes as the latest Halifax House Price Index for February showed monthly house price growth slowed to 0.3% from 0.8% in January but was at a four month high annually of 1.3%.
This put average UK house prices at £301,151.
Amanda Bryden, head of mortgages at Halifax, said: “These latest figures suggest the market has regained some momentum after a softer end to 2025. While industry data for January show a slight easing in new mortgage approvals, overall activity has continued to prove resilient.
“There’s no doubt that affordability remains stretched, supply is constrained, and regional disparities persist. For those without family support, the path to home ownership feels particularly challenging.
“However, conditions have been gradually improving, with easing interest rates and real wage growth helping to support buyer confidence. As ever, timely and expert advice remains key to helping more people achieve their goal of stepping onto the property ladder. “Looking ahead, geopolitical uncertainties seem set to influence the outlook for inflation and the wider economy. Against that backdrop, markets are now anticipating a more gradual path for interest‑rate reductions. If realised, the speed at which borrowing costs ease may be tempered.”
Commenting on the index, Tom Bill, head of UK residential research at Knight Frank, said: “Momentum in the housing market had been rebuilding after November’s Budget and the outlook for mortgages was brighter only a week ago.
“However, a prolonged conflict in the Middle East would dampen sentiment and delay rate cuts due to rising inflation, which would put downwards pressure on prices.
“That said, we have seen how quickly interest rate expectations can change this year, and the underlying weakness in the jobs market is one of several reasons that multiple cuts could come back onto the table in 2026, which would support demand. A lot hinges on the length of the conflict.”